Profitable trades with the RSI indicator
The general rule of trading on the options market is the following: you should bet on increases during moments of maximum price reduction, and on decreases during moments of maximum growth. The RSI indicator, which measures the strength of the market, will help you determine the right time.
How the RSI indicator works
The RSI (Relative Strength Index) measures the current market indicators with respect to previous dynamics. Simply put, the RSI shows us the maximum deviation of the asset price from its center axis (average price). And this is exactly what you need to determine when to conclude a transaction!
How to use the RSI indicator
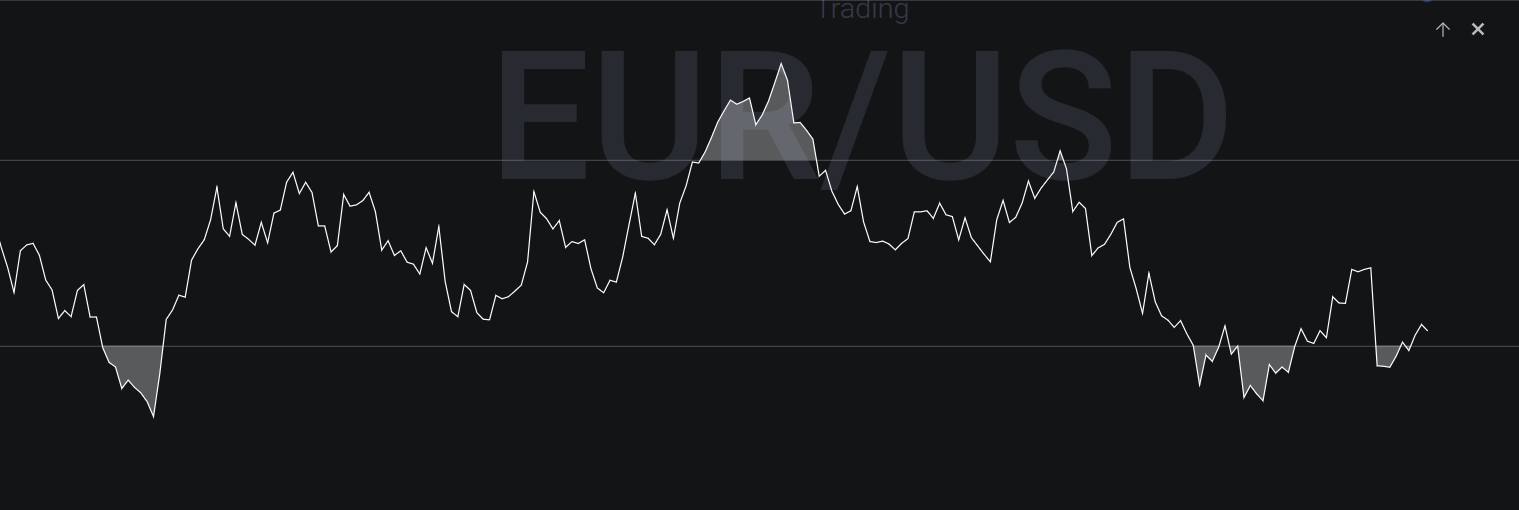
The RSI indicator is easy to use. It is a line that moves on a scale from 0 to 100 showing changes in market forces:
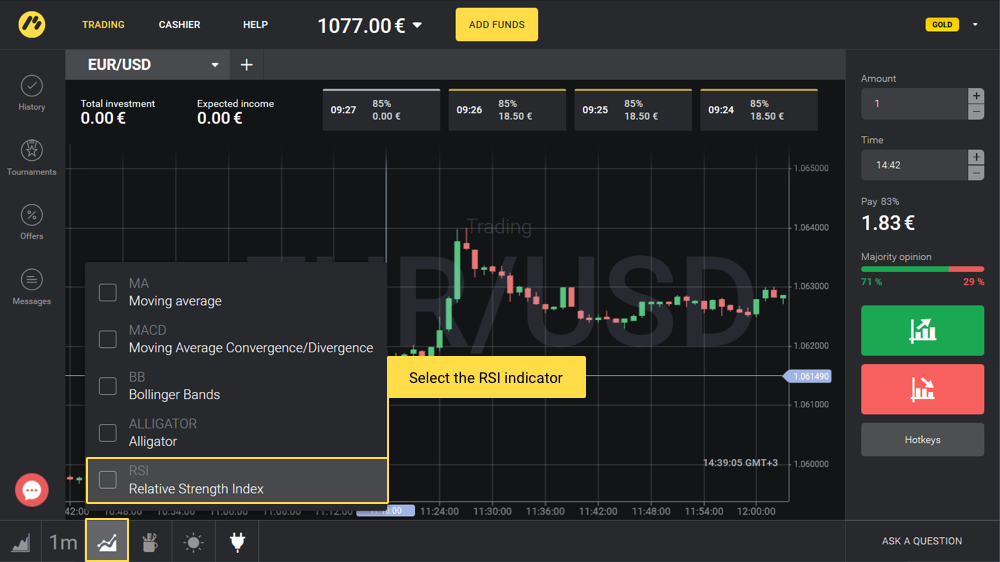
To apply the RSI to the price chart, select it in the list of indicators in the lower left corner of the Binomo platform:
RSI indicator signals
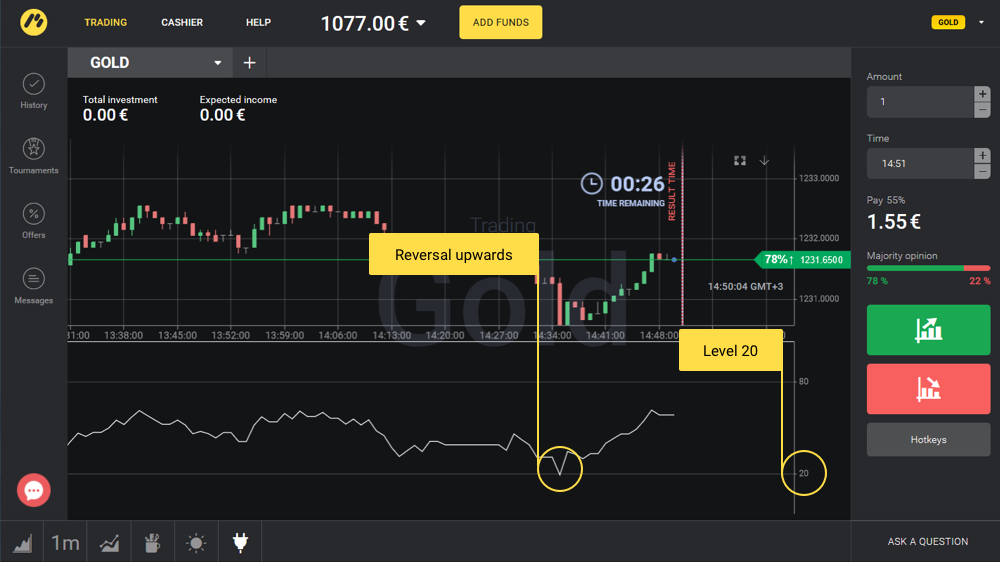
Signals for transactions on an increase are considered situations where the signal line of the RSI indicator drops below the oversold level of “20,” and then reverses back for growth:
After that indicator signal, the asset quotes most often reverse in the direction of growth, which you can see in the screenshot above.
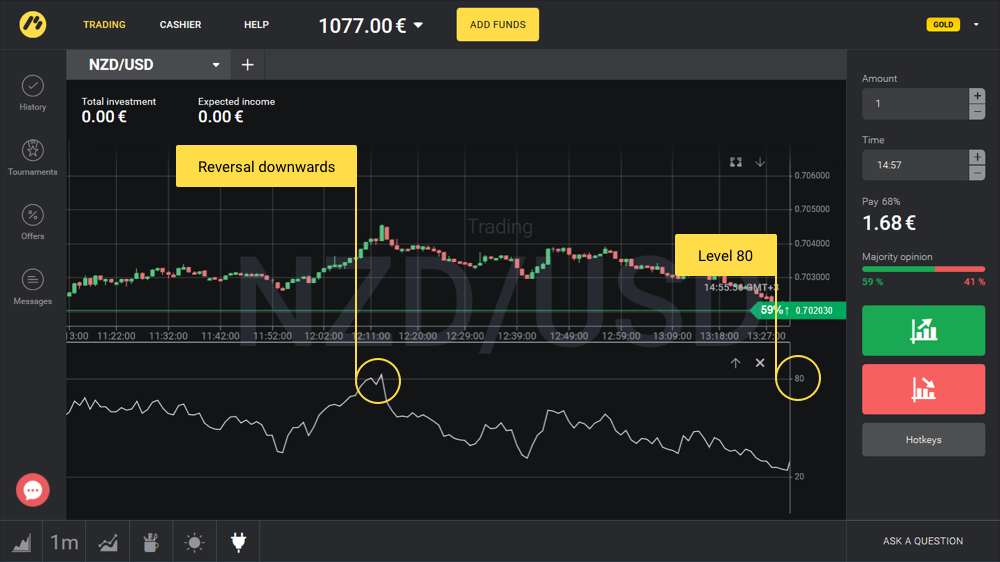
Signals for transactions on a decrease are considered situations where the signal line of the indicator rises above the overbought level of “80,” and then reverses back for decline:
In most of these cases, the price on the quote chart begins to fall:
RSI signals are quite simple and informative. This technical indicator is most often used for the construction of effective trading systems for trading on binary options.


