Super Pattern for binary options
Another pattern that should be analysed for binary options trading is Harami pattern, made by only 2 candles. Let’s see together how it’s structured. First of all we should say that it can be both upward (Harami Bullish) and downward (Harami Bearish) and its task is anticipating a possible inversion of trend.
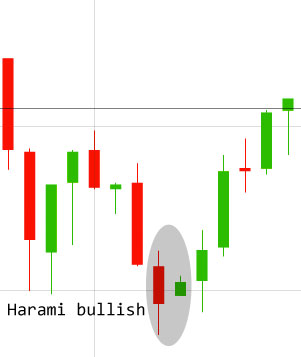
 Here on the left you can see an Harami bullish pattern that is made by the two simple candles you find underlined into the gray oval. These two candles must be at the end of a downward trend and indicate that we are approaching an upward stage. The first candle is obviously red and with an evident body, the second one must be smaller than the first one, no matter which colour (it can be red or green) and its body should be preferably placed in the middle of the first candle body. What does this last feature mean? Generally a candle starts where the previous one ends. The fact that the opening price of the second candle in this pattern must be higher than the closure price of the first one, means that the market suffered a sort of shake, a sort of upward frenzy which tells us that the closure price of the first candle isn’t the price that the market wants in such moment and so it’s necessary to heighten it. The more the starting trend is greatly downward, the more this pattern seems acquiring power. The fact that the body of the second candle is smaller than the previous one means that there’s indecision and so the large fall is put at risk and an upward stage could occur.
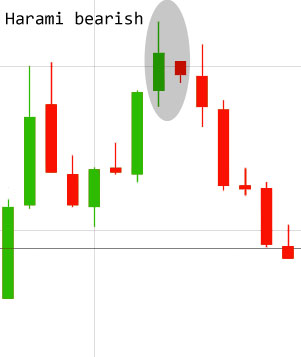
 Here on the left you can see a bearish Harami pattern, made by two candles that announce us a new downward stage immediately after the upward one just concluded. In this case too, the conformation is the same as the previous one, but the first of the two candles is green and the second one is much smaller and should open lower than the closure of the first one. This indicates a strong indecision of the market with the possible development of an inversion of the trend.
How can we use Harami pattern for binary options?
Let’s start saying that this type of pattern seems more effective with high time frames, for example 1 day, 4 hours or 1 hour, but in the meantime it shouldn’t be undervalued for short time frames, such as 1, 5 or 10 minutes.
At the closure of the second candle of the pattern we can try to invest in the opposite direction as to the one of the trend that precedes Harami pattern. So in case of an Harami Bullish pattern we will invest upward while in case of an Harami Bearish we will invest downward. The option expiration, in my opinion, shouldn’t be too far: from 2 to 5 candles maximum from the considered time frame could be a good strategy to trade with binary options exploiting Harami pattern.
As always pay attention and be aware that there’s no guarantee of success. The only thing we can say is that the experience often proved we were right using this strategy, that can be decidedly profitable.
If you want to try it on paper or with a demo account, you can post the results you obtained in the comments area below, so that we can analyse them together.


