ADX EMA Strategy
I am well aware that many of you expect the fastest possible results and real profits from transactions on Binary Options. So I prepared a brief description of a strategy, which I find not only very effective, but also simple to use. It is based on the combination of two standard indicators available in each analytical program – ADX and EMA. We recommend uTrader, which is a regulated broker in the EU, and has an accounts in many local currencies.
ADX EMA strategy
To use this strategy we will use price charts with a one-minute time frame. The expiration time of the operation as the name suggests will be 60 seconds. As I just mentioned, we use two indicators here:
ADX
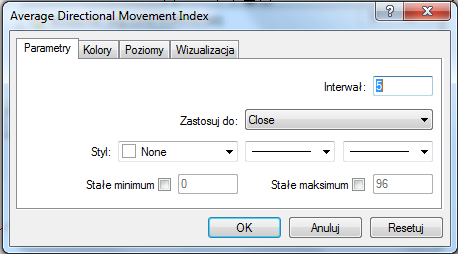
ADX (Average Directional Movement Index) – average directional index of movement. This is a standard indicator for the MetaTrader 4 platform. The default period for the indicator is 14 candles (in our strategy it will be 5 candles). The period is working, because the more investors see the signals, the better because of the accumulation of purchasing power.
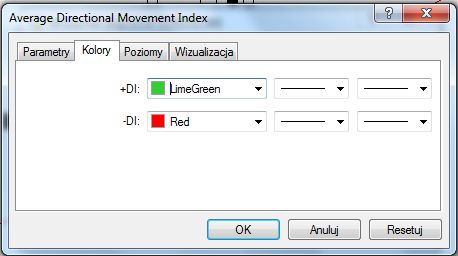
ADX alone verifies only the occurrence of a trend when it exceeds the value of “20” and continues to rise and the strength of the trend. This is complemented by two additional lines – + DI (line of bullish movement) and -DI (line of bearish movement). Thanks to them, we receive confirmation of input or exit signals.
Moving Average
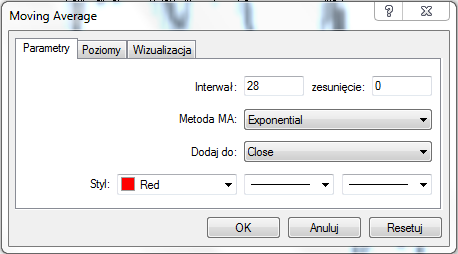
Moving Average – in our case, 28 periods. If we used only this indicator, closing or opening positions would occur at the moment of crossing the Exponential Moving Average by price.
CALL OPTION – GROWTH
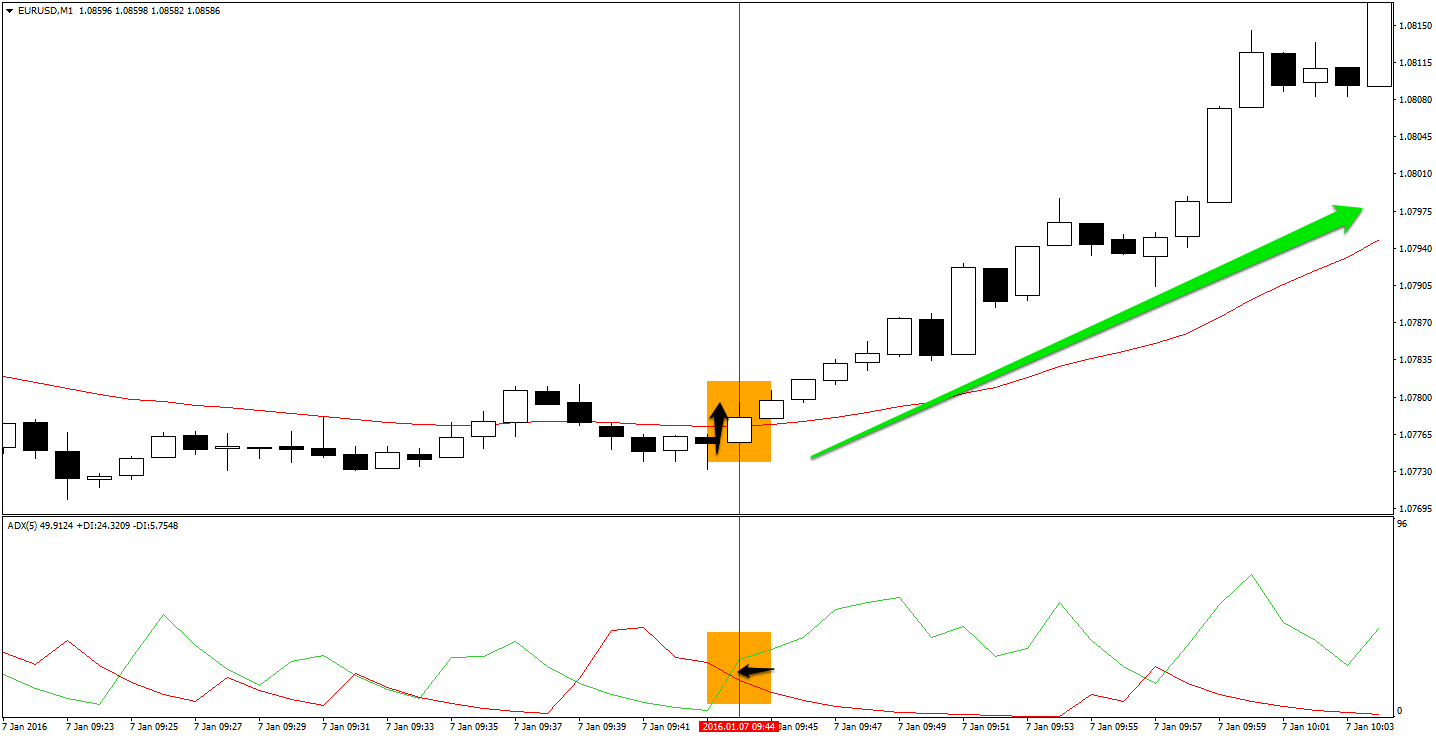
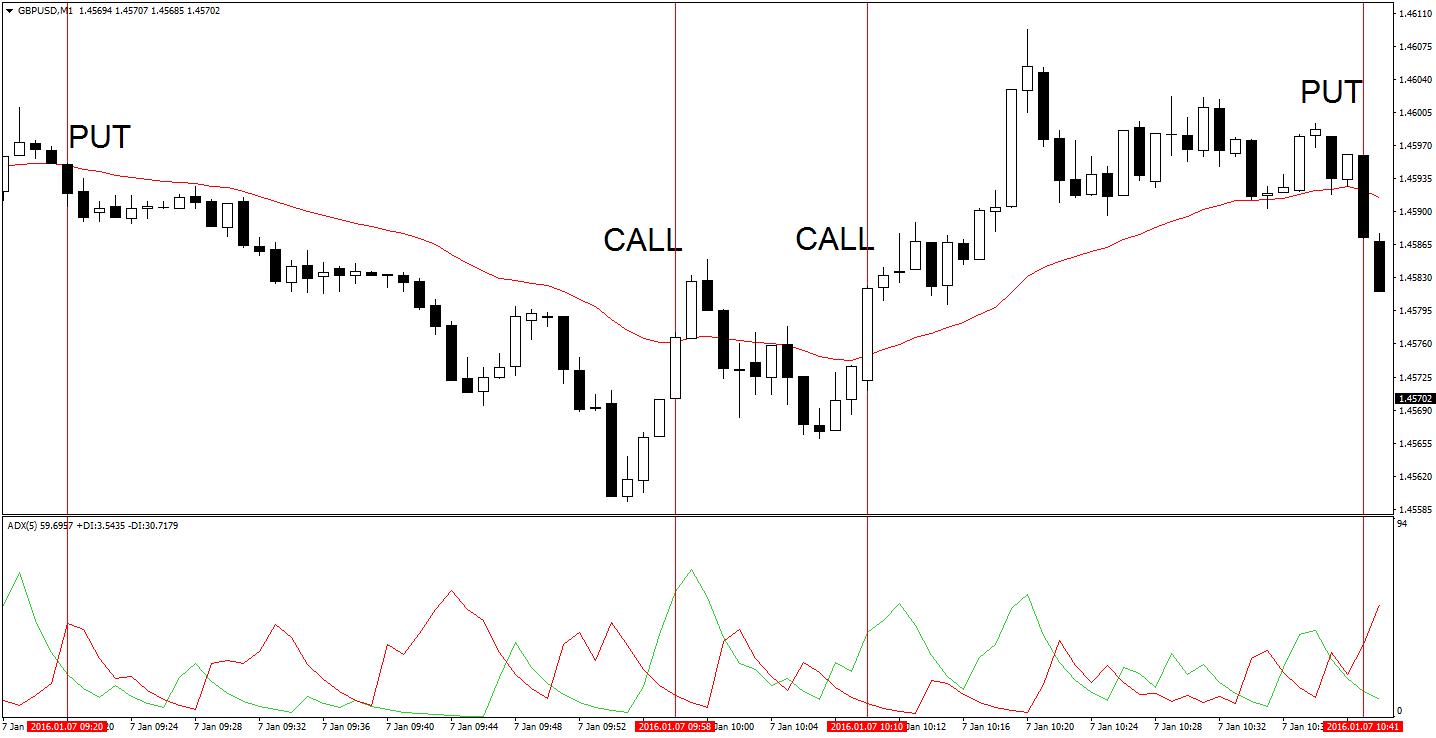
In the case of a 60 second ADX EMA strategy we decide to open CALL option,when :
- the green ADX line is located above the red line
- price crosses and is above EMA 28
- the body of the signal candle presents an upward trend
- the signal is even stronger when the candle preceding the signal candle also has a bullish body
PUT OPTIONS – FALL
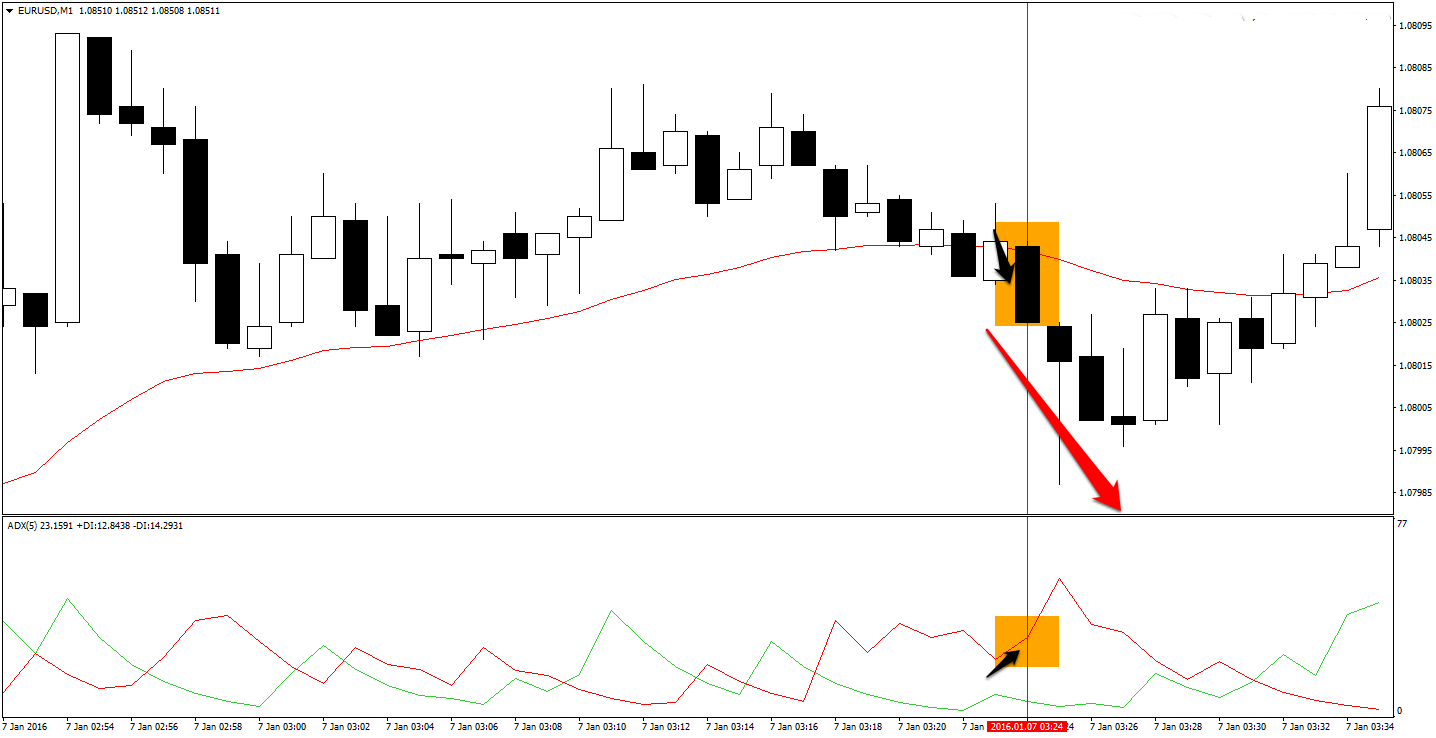
In the case of the 60-second ADX EMA strategy, we decide to open the PUT option when:
- the red ADX line is above the green line
- price crosses and is below EMA 28
- the body of the signal candle presents a downward trend
- the signal is even stronger when the candle preceding the signal candle also has a bearish body
The chart below shows some examples of bets on GBP/USD M1 :
Based on: https://www.binaryoptionsdaily.com


