Candle watcher
What do you think is the most important quality of a trader? Patience! If you have it, then you can easily earn on this strategy for binary options. You need a candlestick chart and your favorite indicators to confirm the signal. Pour your coffee and get ready: you need to watch carefully, and react quickly.
How to trade
Choose a timeframe from 1m to 5m.
How to conclude transactions UP
We only conclude transactions UP on a growing trend.
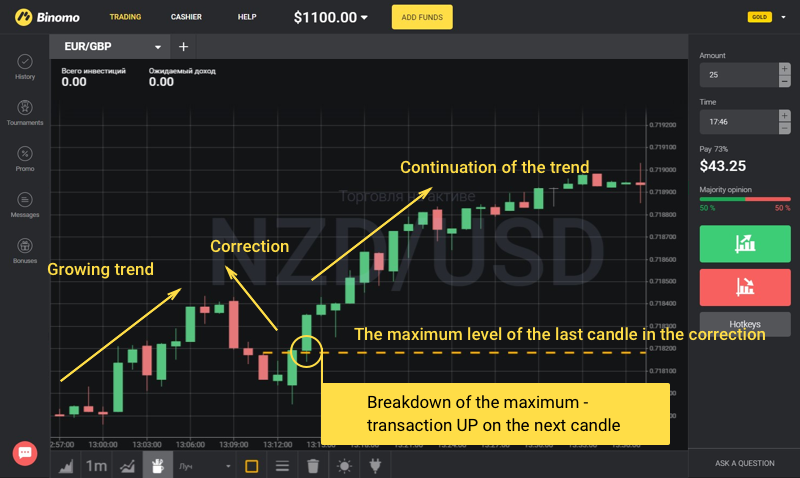
We wait for the beginning of correction: at least three falling candles in a row. The correction should be quite sharp, but not too strong or long, otherwise it will be a trend reversal instead.
We found correction, now what? We wait for the price reversal. When the green candle breaks through the upper level of the last red candle, this will be the signal of the end of correction.
The breakdown should be fairly certain: the maximum of the red candle should be significantly lower than the end of the green.
The transaction is concluded on the next candle after the breakdown one for 3-20 minutes.
This is how it looks on the chart:
How to conclude transactions DOWN
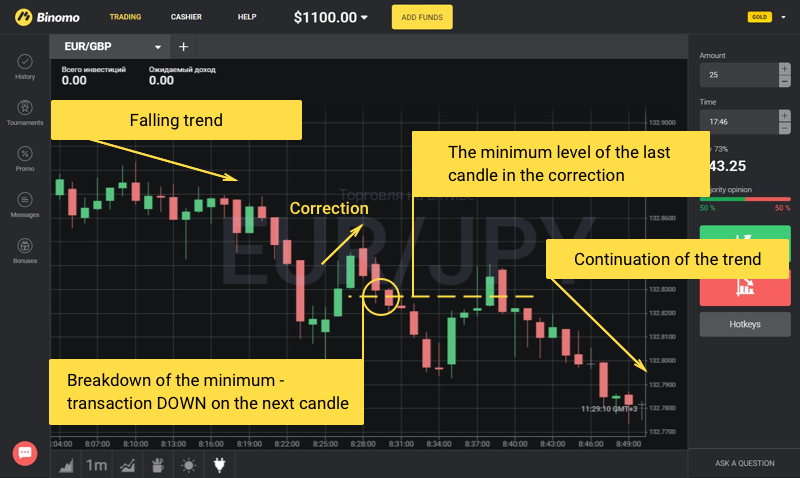
Everything is the same, but in the opposite direction. After the correction is over, the red candle should break through the lower level of the previous green candle:
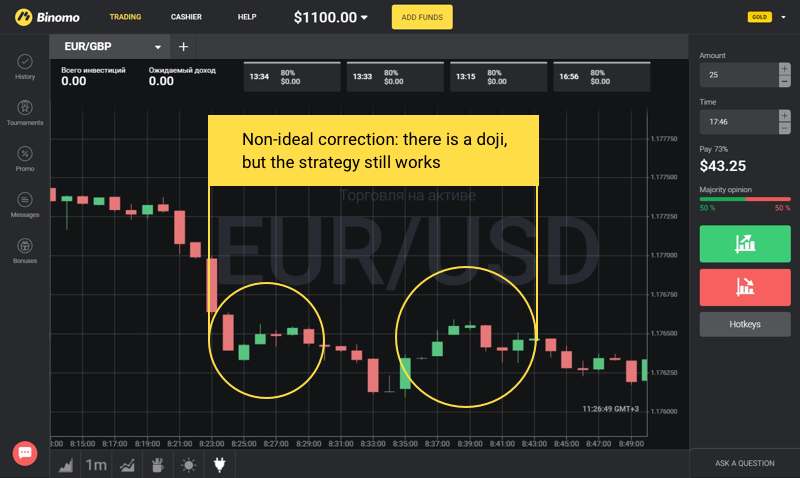
Important! Not all corrections are ideal. There could be dojis (this is when the opening price is equal to the closing price) or inside bars (candles that do not go beyond previous candles, called “candle in a candle”) within them. If only a few of them appear in the direction of the correction, they can be ignored.
But you still shouldn’t conclude a transaction if there are too many “extra” candles or if two new candles have formed on the trend, but the minimum/maximum is not broken through. It is better to wait for the next correction.


