Four different types of moving average
Your capital may be at risk. This material is not an investment advice.
The moving average (MA) is one of the most widely used technical indicators, and with good reason — the indicator is both simple and effective. Do you know what is moving average and how does it work in trading?
The moving average is based on past prices and can be categorized as a trend-following indicator. It measures average price for a particular trading instrument over a specified time period.
Its main function is to reduce the price noise and smooth out the price action. In practice, the general idea behind the indicator can be represented by four different types of it: simple moving average (SMA), weighted moving average (WMA), exponential moving average (EMA) and smoothed simple moving average (SSMA).
The two most commonly used variations of the moving average are simple moving average and exponential moving average. While SMA is a simple average of the asset prices over a set period of time, EMA prioritizes more recent prices by assigning them with bigger weights. WMA gives the highest importance to the most recent candlestick, too. SSMA does not concentrate on a specific period and is rarely used in trading.

How to set up?
Here is what you want to do in order to set up the indicator in the IQ Option platform:
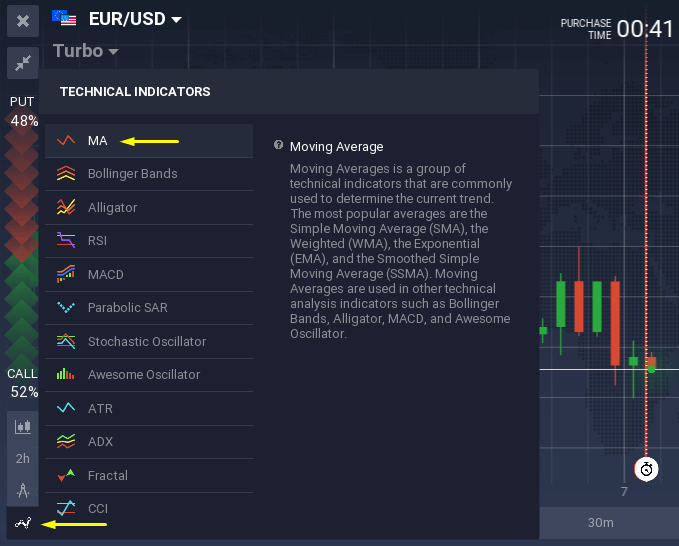
- Click on the “Indicators” button in the bottom left corner of the screen, then pick “MA”.

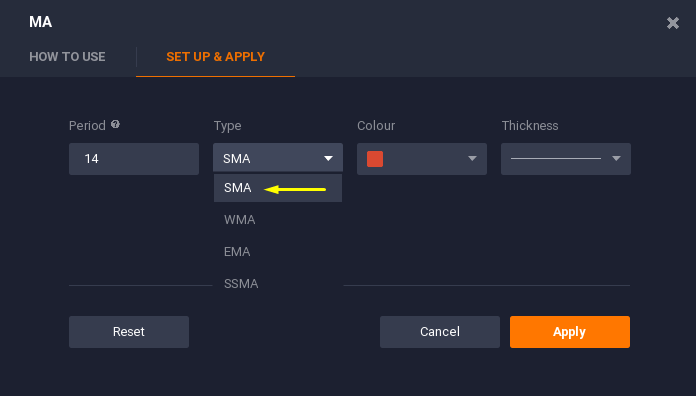
- Switch to the “Set up & Apply” tab.

- Choose the desired MA type, adjust the time period and click “Apply”.
As a rule, a simple moving average with a longer time period is used to determine long-term trends, while short-term trends can be caught with a shorter period EMA. Short-term EMA will look choppier, long-term SMA looks smoother.
How to use in trading
Despite being a basic technical analysis tool the moving average has a lot of practical applications in trading.
The most common one is to identify the existing trend. By smoothing the price action and reducing the noise the moving averages lets the trader look at the real picture behind sporadic price fluctuations.
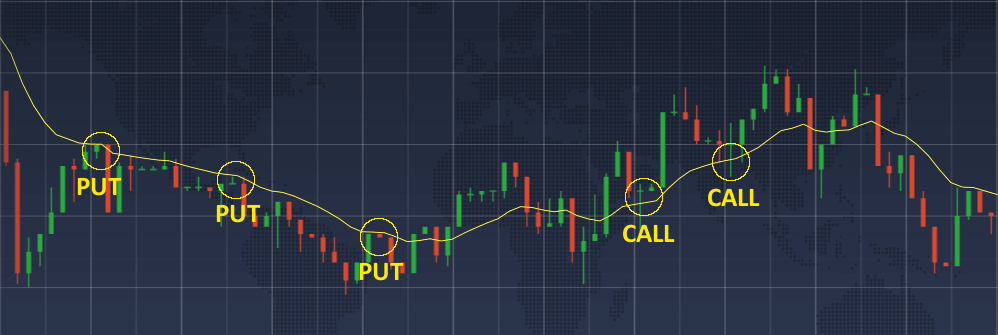
The MA can also be used as a dynamic support and resistance line. The basic principle is to sell when the price touches the moving average from below and to buy if the price chart is situated above the MA line and slowly approaches it.

More than that, some quite sophisticated indicators such as Bollinger Bands, MACD and the McClellan Oscillator are based on moving averages.
Conclusion
Being an indicator that is based on past performance of the price action, the moving average cannot adequately predict neither future direction of the trend, nor its strength. All of the above doesn’t, of course, mean that MA is useless. By analyzing the past, we can receive the information that is necessary for future predictions. In other words, the MA cannot make an accurate forecast, but it can help us make the forecast ourselves.
The moving average is a simple yet powerful tool and comes in many forms. Each of them is best suited to fulfil its own task. Don’t let the simplicity of the moving average fool you, this indicator needs a lot of practice to be used effectively.


