Points out the turning moments
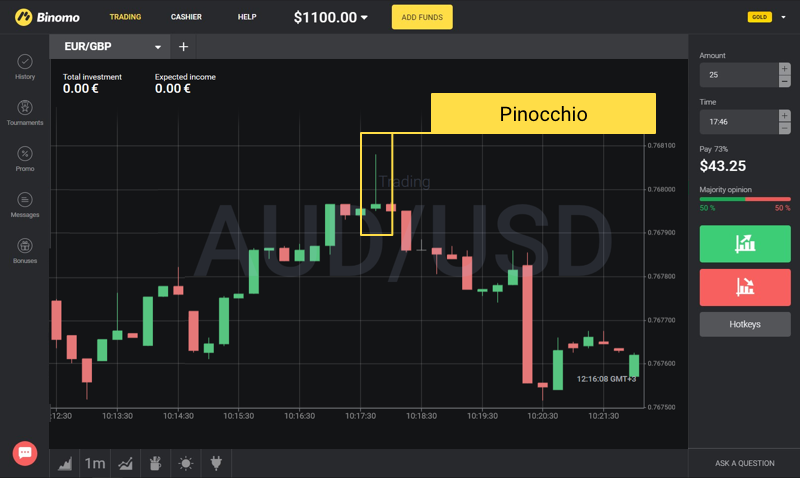
The information you see below will help you learn to use the Pin Bar as a tool for making profit. This pattern is easily recognised on charts: it’s a candle with a small body, a small shadow on one side and a big shadow on the other. Traders call it “Pinocchio” and consider it a good balid signal for making deals.
Pinocchio usually appears at the top or the bottom of the trend just prior to a turn. The long shadow of the Pin Bar always faces the direction of a “dying” trend:
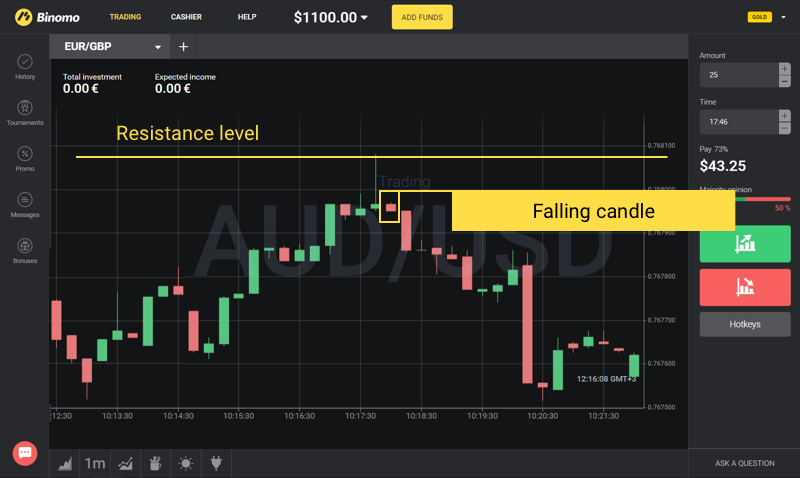
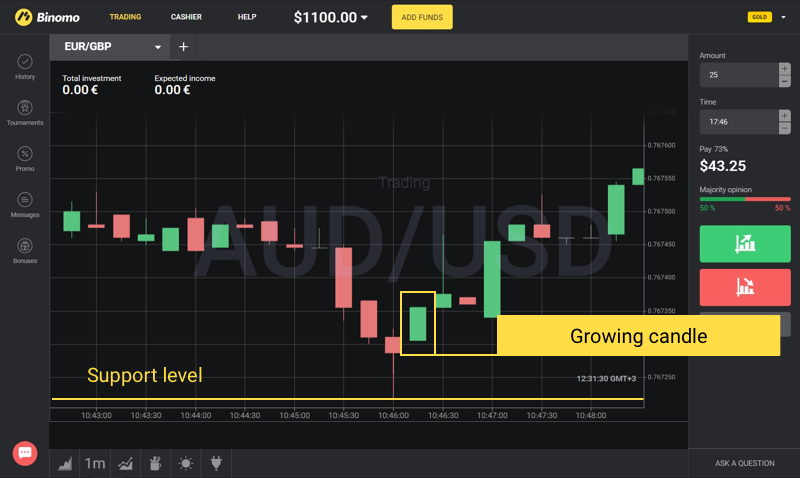
This candle rests its long “nose” on the strong levels of support or resistance, at which market participants open trading positions. Having reached those levels, the quotes make a u-turn, and a candle with a long shadow appears on the chart.
Keep these important rules in mind:
- Pinocchio appears only at the top or bottom of the trend. If a candle of this type appears during a horizontal trend (flat), it does not indicate a turn;
- The long shadow of Pinocchio always faces the direction of the trend. The trend seems to be making a push back for a turn with this “nose”;
- When a Pin Bar appears far from the support or resistance levels, it is better to ignore such a signal, since there is no technical basis for a turn.
How to make money with Pinocchio?
In our earlier articles, we talked about methods of determining support and resistance levels. Be sure to do this before applying Pinocchio, since the signal is valid only when it appears next to these levels.
Buy a call option (make an UP deal) if the Pinocchio Pin Bar is followed by a growing candle that confirms the turn:
Buy a put option (make a DOWN deal) if the Pinocchio Pin Bar is followed by a falling candle that confirms the turn:
We advise to use not more than 3% of the deposit for making deals!


