Signal of trend continuation – Flag Figure
When the Flag appears it means the correction is over.
In other words, if you detect a Flag and close the transaction in the direction of the trend, you’re highly likely to make a profit!
What does the Flag look like?
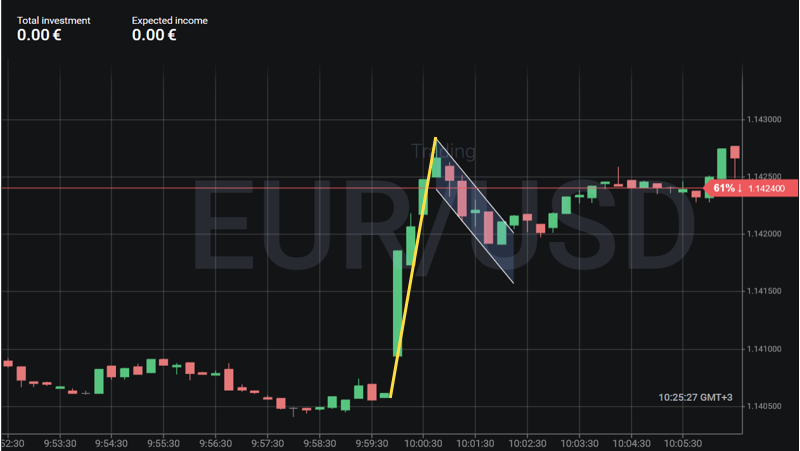
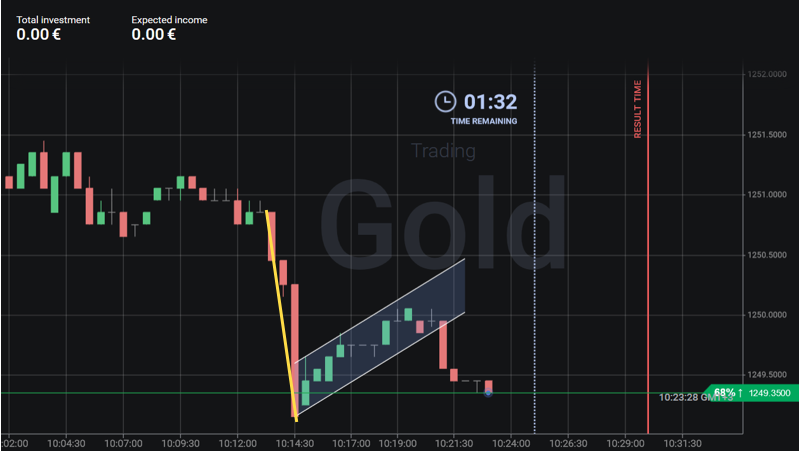
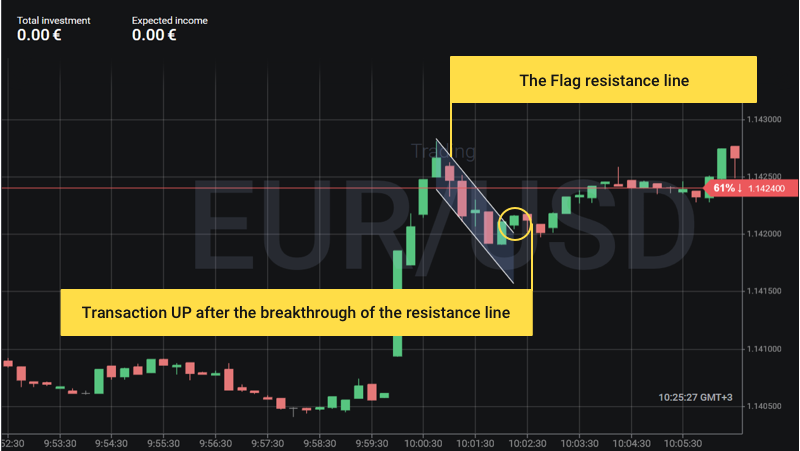
As we mentioned above, the Flag appears during active movement of the price. After several long candles (so-called “flagpole”), the quotes enter a short correction (the Flag itself).
This is how the Flag looks like in a growing market:
This is how the Flag looks like in a falling market:
How to conclude transactions
We recommended to open transactions once the quotes break the Flag in the trend’s direction.
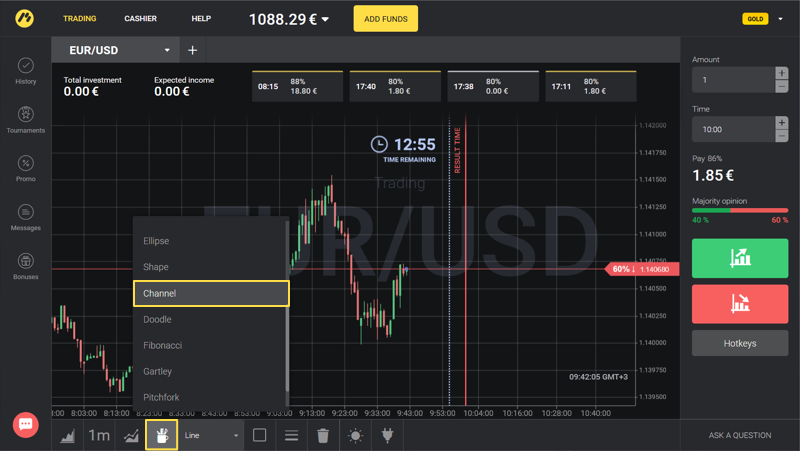
When you see a high “flagstaff” (one or several long candles) on the chart and the correction begins, select the Channel tool in the lower left corner of the Binomo platform and use it to determine the local highs and lows of the correction:
Transactions UP are conlcluded in a growing market, when a candle breaks the resistance line and closes above the Flag:
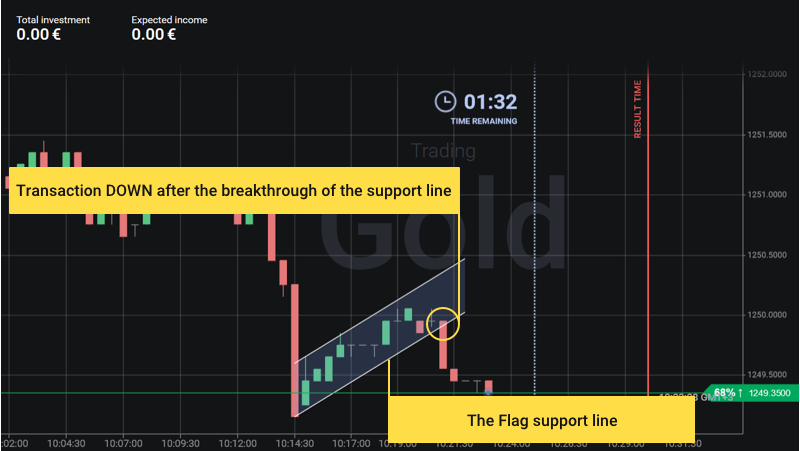
Transactions DOWN are conlcluded in a falling market, when a candle breaks the support line and closes below the Flag:
ATTENTION! Flag is a figure of trend continuation, therefore we do not recommended to conclude transactions DOWN in a growing market or UP in a falling market (against the trend).
Flag strategy works with any asset and timeframe and generates accurate and profitable signals, as long as the settings are correct. If you are a beginner, we advise you to try building this pattern on a demo account first.

