S&P500 – signal for declines
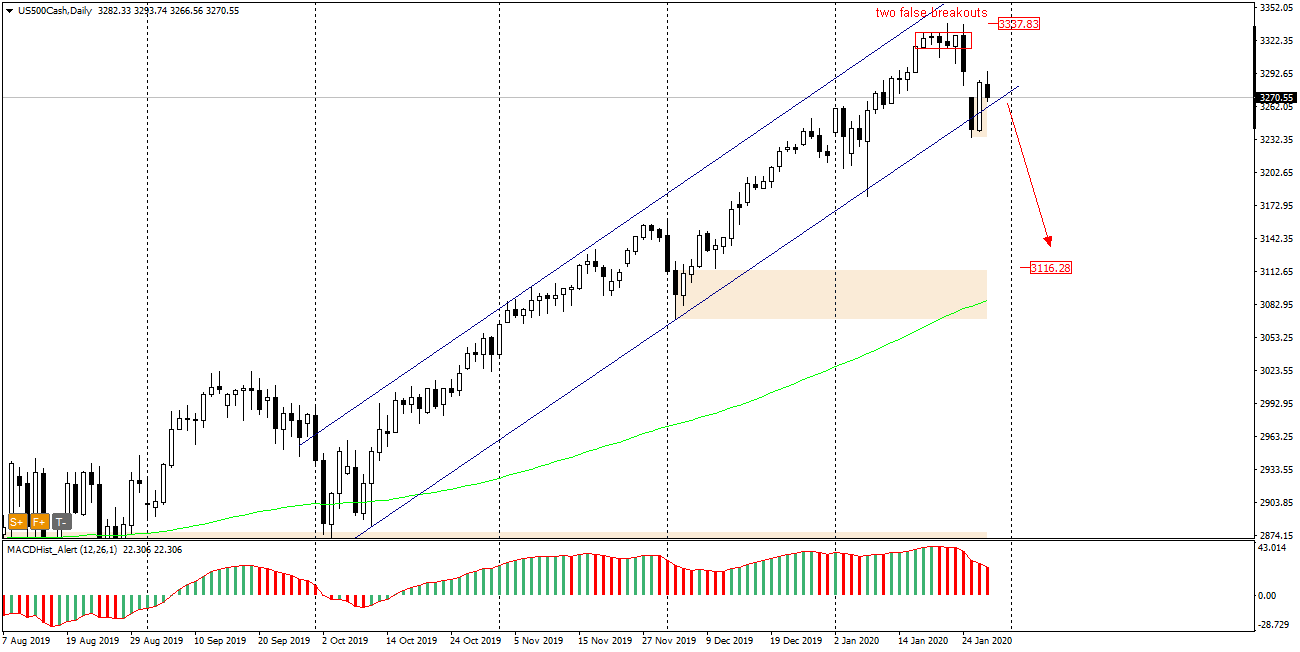
The S&P500 index, after many weeks of almost uninterrupted growth and the setting up successive ATHs, stopped at 3338. The daily candle of 17 January and another one formed an inside bar. The next few days were attempts to break it up and down, but at the end of the session the index always returned to the inside bar formation. It wasn’t until Friday, January 24th, that the breaking down proved effective and the index started moving south. Monday’s opening took place with a downward gap , which was closed thanks to today’s increases
The declining MACD indicates the appearance of bearish sentiment among investors, the falls seem inevitable. Undoubtedly, the crisis situation in China caused by the coronovirus has contributed to the worsening of moods on all stock exchanges.
Restrictions on movement in quarantined areas, company shutdowns, a closed stock exchange until 3 February and huge losses in the transport and tourism industries may cause a fall in China’s GDP of at least 5%, so the coming declines will not come as a surprise. The sellers may target the 3115 demand zone.


