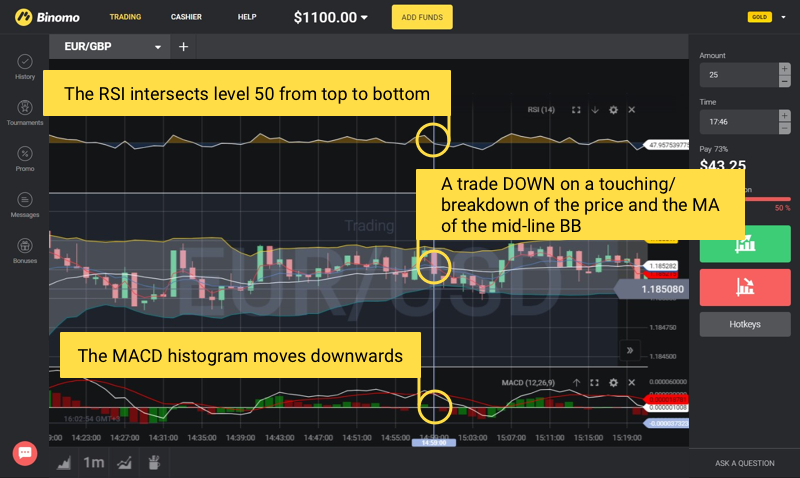
Strategy for flats – All inclusive
To apply these tactics, the trader will have to be like Julius Caesar. First, you’ll need to use a lot of indicators, and secondly, the strategy is based on strict observance of ALL entry rules. Favorable conditions for this strategy often occur on long sides (flats), and you can earn without waiting for market volatility.
Customizing the template
It works for any asset at any time. We chose the 1m timeframe.
We add the following to the chart:
- 2 “moving average” indicators: method Exponential, periods 3 (red) and 10 (blue)
- MACD: periods 12, 26, 9 (default settings)
- RSI: period 14, levels 50
- Bollinger Bands: period 20, deviation of 2 (default settings)
Trades UP:
The price and EMA 3 should be lower (the level) than EMA 10 and inside the Bollinger Bands.
The RSI and the MACD histogram are below the levels of 50 and 0, respectively.
The price and EMA 3 intersect EMA 10 and the central Bollinger Band line.
The MACD histogram intersects the middle line and/or moves upwards.
The RSI intersects level 50 from bottom to top.
Entering: at the intersection of the price and both EMA with the central line of the Bollinger Bands.

Trades DOWN are the mirror opposite:
The price and EMA 3 should be higher (the level) than EMA 10 and inside the Bollinger Bands.
The RSI and the MACD histogram are above the levels of 50 and 0, respectively.
The price and EMA 3 intersect EMA 10 and the central Bollinger Band line.
The MACD histogram intersects the middle line and/or moves downwards.
The RSI intersects level 50 from top to bottom.
Entering: at the intersection of the price and both EMA with the central line of the Bollinger Bands.
We enter on 1-5 minute expirations.


