Triangle price figures
What if there is uncertainty on the market? When there is no macroeconomic data, no political risks, or no other news? Most often, at this moment a price figure called “triangle” appears on the chart, which makes it easy to determine when and in what direction it would be better to trade.
What is a “triangle” price figure?
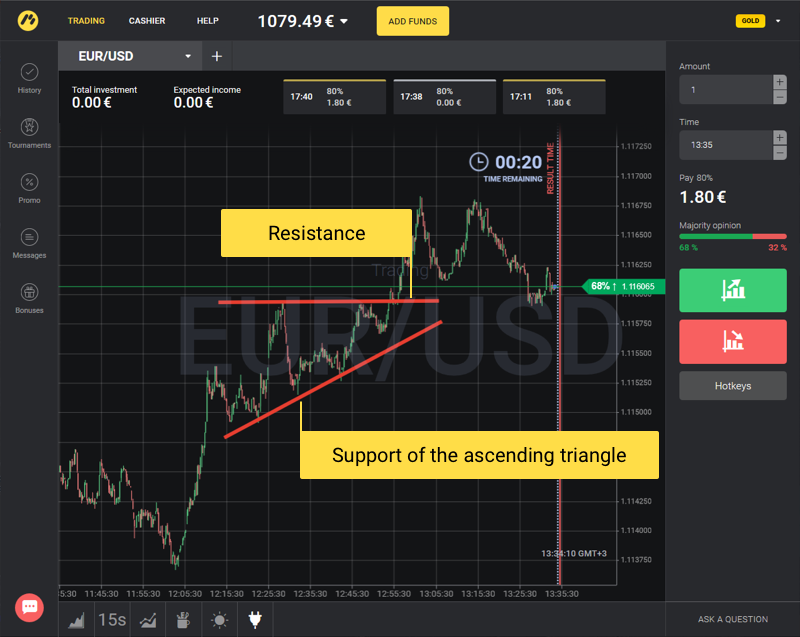
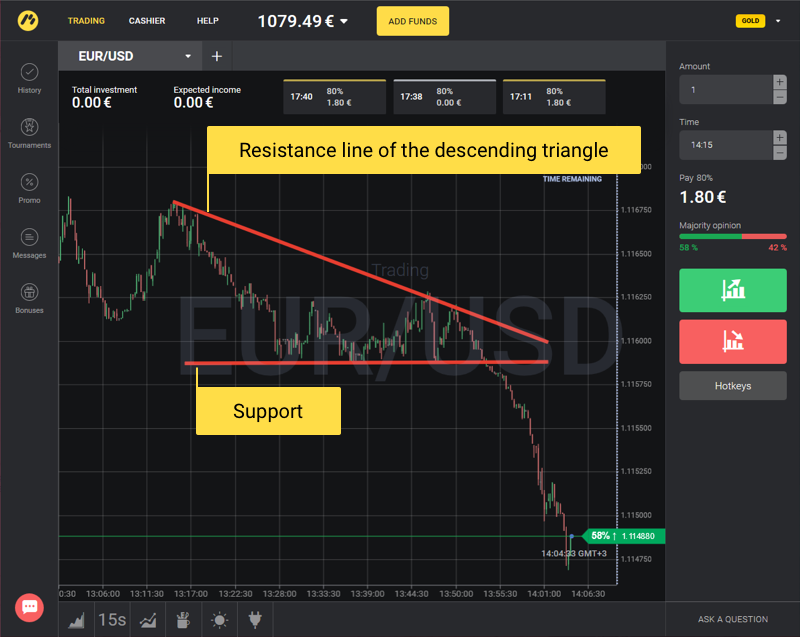
When the volatility (mobility) of quotes decreases as well as the volume of exchange trades, a triangle is being formed on the chart – a gradual narrowing of the price movement amplitude. Within this narrowing, support and resistance lines are being formed, which are the boundaries of the triangle:
Support line of the ascending triangle is directed upwards, and the resistance line is almost horizontal (as in the example above). According to the rules of technical analysis, as for ascending triangle, the price, most likely, breaks the upper limit, and quotes begin to grow actively upwards.
In most cases, triangles appear during correction and are figures that represent the course of the main trend. That is, an upward triangle appears when correcting an upwards trend, and a downward triangle appears when correcting a downwards trend. The breakdown of the support line in both cases will indicate the end of the correction and the course of the main trend.
And this is a great time to make a transaction!
Are there symmetric triangles?
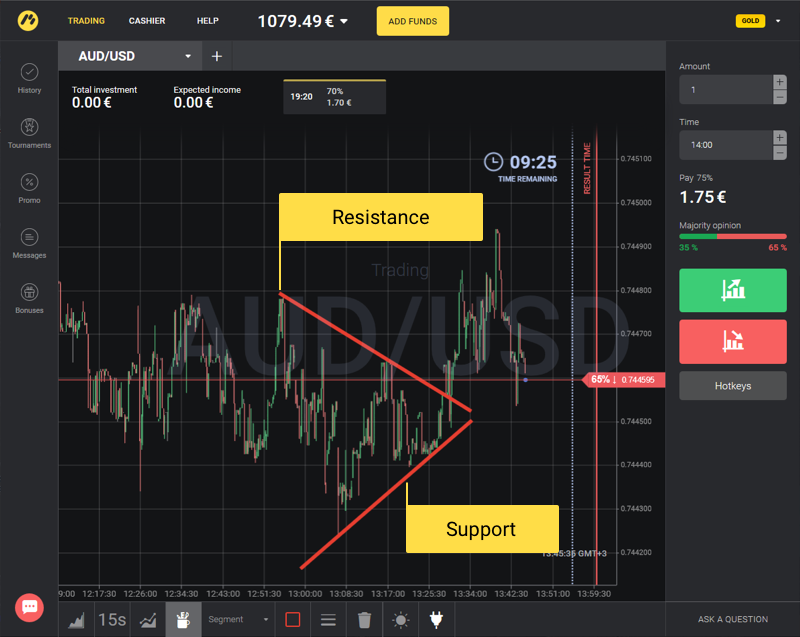
Yes, there are. In this case, the support and resistance lines are equally narrowed. A symmetrical triangle is a neutral figure, after its formation the price can equally move both upwards and downwards:
How to make transactions
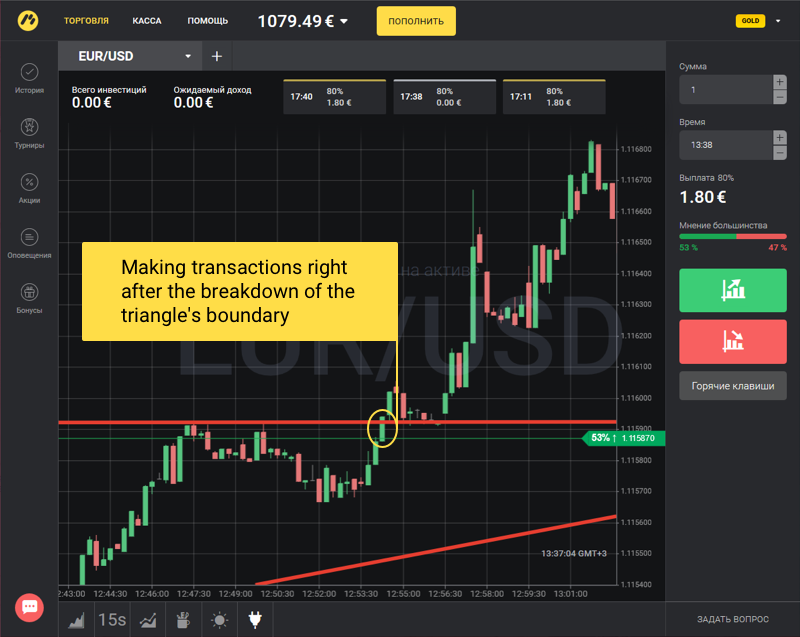
As mentioned above, the breakdown of the upper or lower limit is the beginning of the active price movement towards the breakdown.
It is important to remember that triangles are the figures representing the course of the trend, and it is recommended to make transactions in the direction of the trend.
That is when the ascending triangle appears, we have an upwards trend and trade UPWARDS.
When the descending triangle appears, we have an downwards trend and trade DOWNWARDS.
After the breakdown of the symmetric triangle, it is recommended to trade in the direction of the breakdown.
Transactions can be made in two cases:
1. The candlestick of quotes has broken through the limits and closed behind them:
2. Or after the price is rolled back to the triangle’s boundary:


