What is MACD?
As you probably already know, there is no single ‘best’ technical analysis indicator. Each of them has its time and place. However, if asked to choose their favorite tool, a lot of traders would answer “MACD”. Moving Average Convergence Divergence is a trend following indicator that is used to spot an emerging trend, whether an upward or a downward. It is by right one of the most effective and commonly used technical analysis tools ever created. In todays’ article, we will take a closer look at the indicator and learn how to apply it in trading.
What is MACD?
Moving Average Convergence Divergence will help you spot emerging trends, arguably the most important thing in any successful trading pursuit. But just as any other indicator, MACD has to be used correctly in order to yield tangible results. And you have to understand, what exactly you are working with.
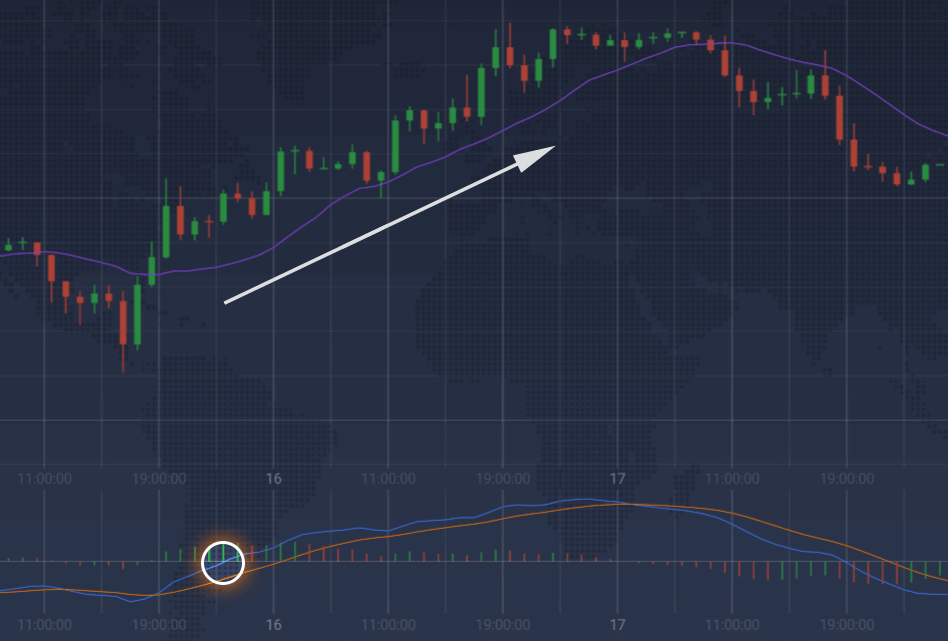
Put simply, MACD is a combination of two lines: a slower moving average (orange) and a faster moving average (blue). The difference between the two is displayed by the red and green bars — hence, the words ‘divergence’ and ‘convergence’ in the indicator’s name. By default, the faster moving average is calculated based on 12 periods, while the slower moving average uses 26 of them.
How to use in trading?
MACD is a complex tool that can be used in several ways:
First, you may want to look for two moving averages crossing over each other. When the faster moving average rises above a slower moving average, an uptrend can be expected. Conversely, when a faster moving average drops below the slower moving average, a downward trend can be expected. This is the most common way to use MACD in trading.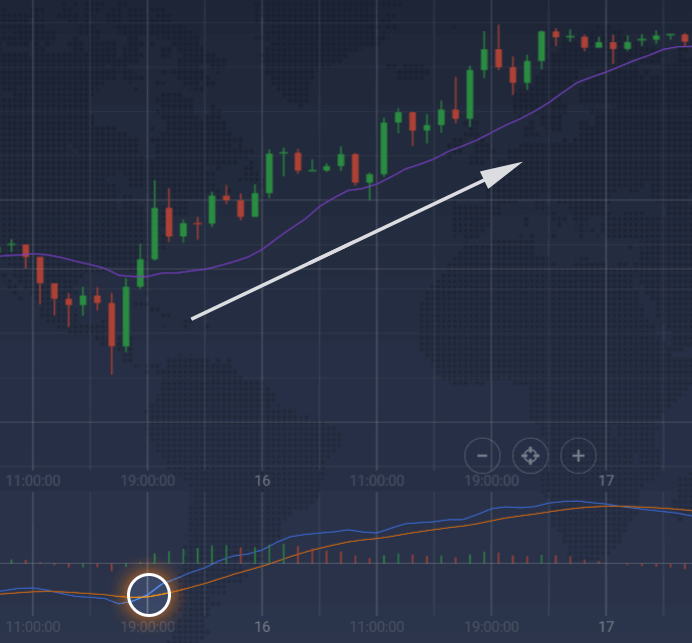
Secondly, keep an eye on the so-called centerline crossover. When the faster moving average moves above the central line (white), the trend can be expected to go up. And vice versa, when the faster moving average moves below the base line, the price can be expected to depreciate. Probably not the most common way to use MACD, it can still be helpful.
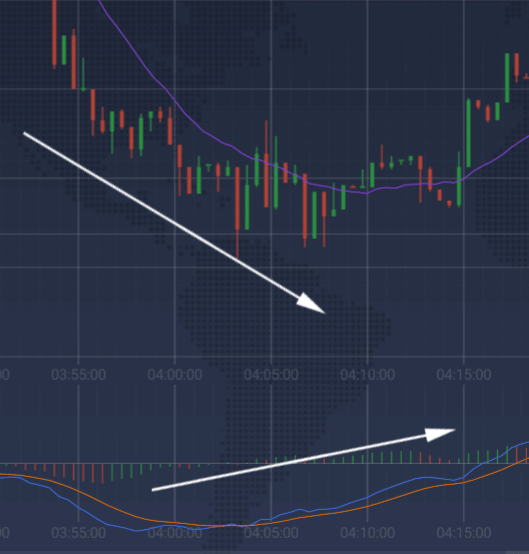
Finally, watch for a thing called divergence. When the price action and the MACD chart demonstrate opposite movement, the trend may soon reverse. A bullish divergence forms when a security records a lower low and the MACD forms a higher low. A bearish divergence forms when a security records a higher high and the MACD Line forms a lower high. This is an advanced technique and will probably require some training to be aplied correctly. Still, it definitely deserves your attention.
Note that all indicators, no matter how good, can and will provide false signals for time to time. It is, therefore, advised to doublecheck the signals you receive with other indicators or different timeframes (preferably both).
How to set up?
Setting up MACD is easy. Simply do the following:
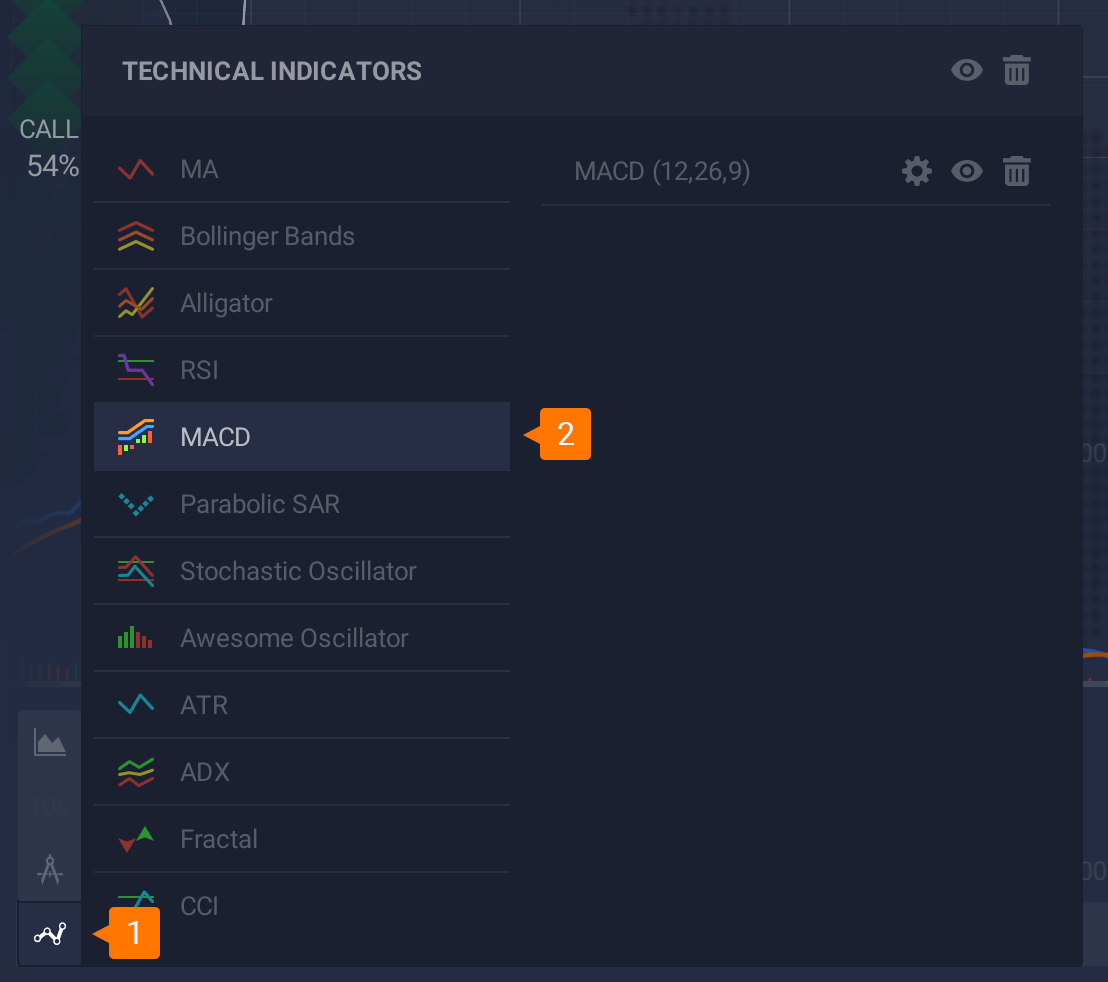
- Click on the ‘Indicators’ button in the left bottom corner of the screen
- Choose MACD from the list of available indicators
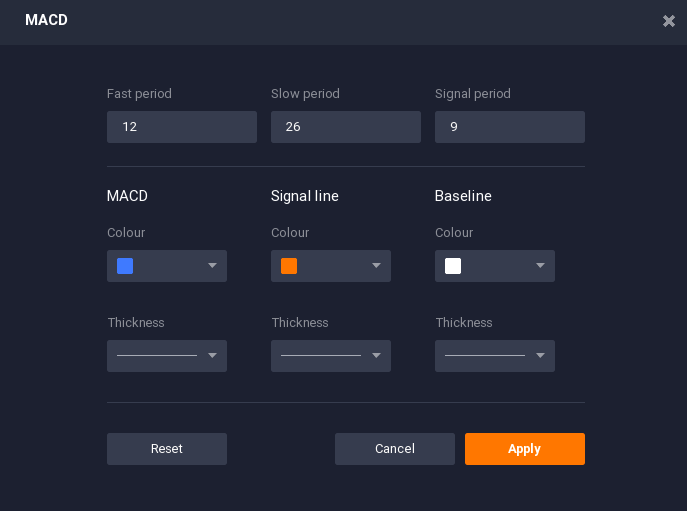
- Without changing the setting, click ‘Apply’
And you are good to go. Now, when you know how to set up and trade using this indicator, give MACD a try. Use it to increase your chances of making correct predictions.
