60 Second Price Action Strategy
Your capital may be at risk. This material is not an investment advice.
One of the most profitable and proven online investment strategies for binary options and Forex would be the versatile Price Action Trading Strategy. One of the wonders about Price Action Trading Strategy would be that it has been used by investors from a variety of different investment industries for over a decade now and it is still one of the most prominent and well-respected day-trading strategies. Perhaps the most appealing nature about Price Action Trading Strategy (PATS) would be that it requires the use of zero technical indicators although access to a charting solution will still be required. If you are looking to implement a consistent and profitable investment strategy then there is no better online day-trading strategy for you.
Covering The Fundamentals
Before we dig deeper into the application of Price Action Trading Strategy though it is imperative that we know the basics associated with this investment strategy. So perhaps the most important lesson we can cover would be that PATS is possible due to the creation of order flow and price action. Order flow, also known as transaction flow, occurs when someone believes the price of an asset will move and then they decide to execute an order (transaction) in the financial markets.
Price action on the other hand is known as the direct derivative of order flow. It is essentially the summation of all buy and sell orders throughout any duration of time. This duration of time can be as little as one second or it can be infinite since time itself is continuous. To expand on this lesson, all of the movement that you see occurring while watching any asset or security is known as price action. One of the most common misconceptions that I have seen across numerous other binary option portals would be how they say price action can result in the formation of two different trends but in all actuality that is not necessary true. There are three possible market trends that can occur in the markets which will be explained further below.
In the picture provided above we have the three possible market conditions that can occur throughout the price action of any one asset or security. A bullish trend is a trend that is heading in an upward direction and it indicates to investors that the bulls (buyers) are in current control of that asset or security. A bearish trend on the other hand is when the price action of a particular asset or security is heading in a downward direction indicating to us that the sellers (bears) are in control of the markets. The last trend that we can witness and should be avoided when using this strategy would be a neutral trend. Neutral trends move in a flat, sideways movement and it indicates to investors that neither the buyers nor sellers are in current control of that asset or security in scope.
Setting Up The Strategy
Now that you have a better grasp on the fundamentals of Price Action, let’s move to the set-up component of this strategy. Since this is a technical analysis based trading strategy, access to a charting solution is required. A few different reputable charting solutions that you could consider using would be MT4, MT5, and FreeStockCharts.com. Once you have your charting solution loaded, you will need to change the time frame to a period of 1 minute and make sure to select a low volatility currency pair to invest. The reason why we want to invest with low volatility currency pairs would be because low volatility currency pairs are less prone to change directions due to minor fluctuations that may occur in the market.
Some low volatility currency pairs you could consider investing when using Price Action Trading Strategy on any timeframe would be the: Eur/Usd, Usd/Chf, Nzd/Usd, Usd/Cad, Aud/Usd, and Gbp/Usd.
Application of Strategy
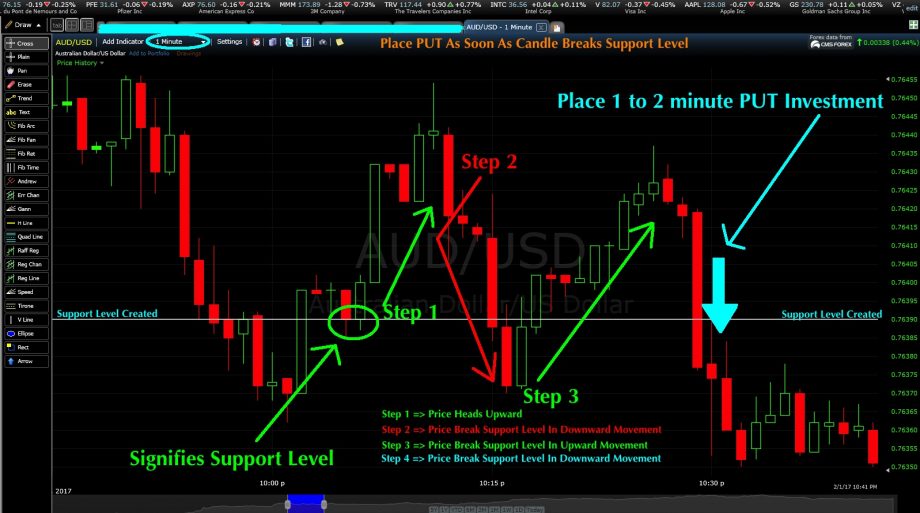
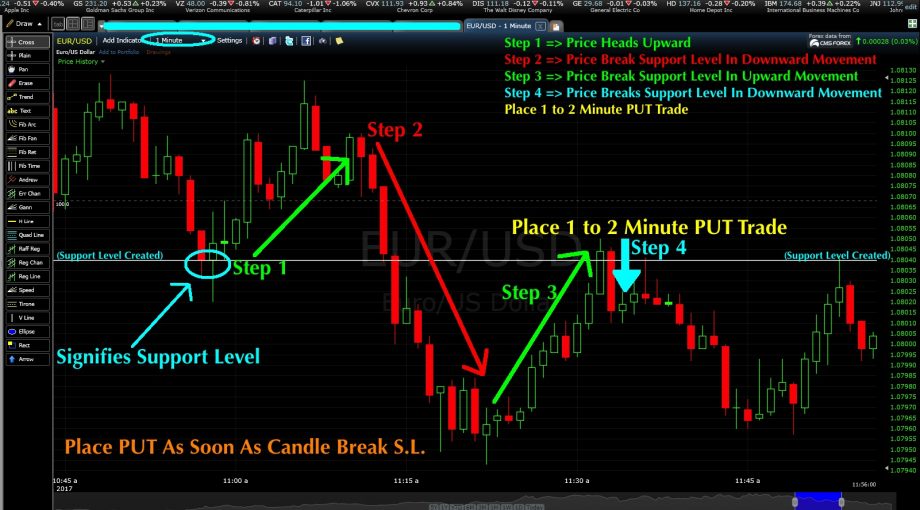
Now that you have your charting solution correctly set up, we will move onward to the actual application process of this strategy. When using this strategy we are only looking for a PUT trade scenario which will occur after the creation of a support level and after four other confirmations are met. A support level can be best described as an imaginary price level where the price of an asset or security hits resistance and then bounces back in a bullish (upward) direction. In order for a support level to be created, we need a bearish candle followed immediately by a bullish candle and the body of both candles must accurately reflect the creation of the support level. Since I know this is quite a bit to digest an example of this strategy with a support level is disclosed below for you.
In order for us to move onward with our 4 required confirmations, the creation of a support level must be present. As you can see in the images above and below, each showcase the creation of a support level prior to the implementation of our 4 confirmations. The four steps that we need to occur next are as followed:
- Price heads in a upward direction (bullish direction).
- Price heads in a bearish direction and breaks our support level with a downward movement.
- Price heads back upward and breaks our support level again in an upward movement.
- Price heads in a bearish direction and breaks our support level in a downward movement.
Each of these steps need to occur in order when applying this investment strategy to your online day-trading. If one of the steps do not occur or occur in a wrong order then the investment is void, just wait for the creation of another support level then execute the four steps provided to you above. If you implement this strategy correctly and apply the tips provided to you below, you should experience an average success rate ranging from 70 to 75%.
Now, one strong recommendation I have for you guys would be to do anywhere between 250 to 500 demo account trades prior to implementing this strategy in a live investment situation. The more familiar and experienced you are with this strategy the better off you will be.


