How to use indicator CCI.
CCI (the Commodity Channel Index) first appeared in specialised literature in the late 1970’s. Donald Lambert created the CCI indicator to analyse commodity markets, but the market history has proven that if CCI “works,” it can be applied to all financial sectors. The currencies, securities and derivatives markets are impractical and overly emotional.
This is evident in the unending cycle of crises alternating with periods of economic recovery. The market reaction to these events is excessive. The ups and downs are so extreme that it sometimes leads to the collapse of individual corporations, and in rare cases, even governments. But eventually the world economy always reverts back to the average state.
What is CCI?
Donald Lambert suggested CCI calculating the stable intervals of fluctuations in the commodity markets, and to consider any unusual deviations from these norms as a sign to enter in the opposite direction, assuming that the system will recoil from the extreme values and gravitate back to the middle.
In most cases, Lambert is right. If we set the indicator to “fast” (the CCI is displayed under the quotes chart), we can look at where the CCI line exits the “standard channel” and see that in four cases the indicator is right (1), but in the fifth case (2), the price “took off”.
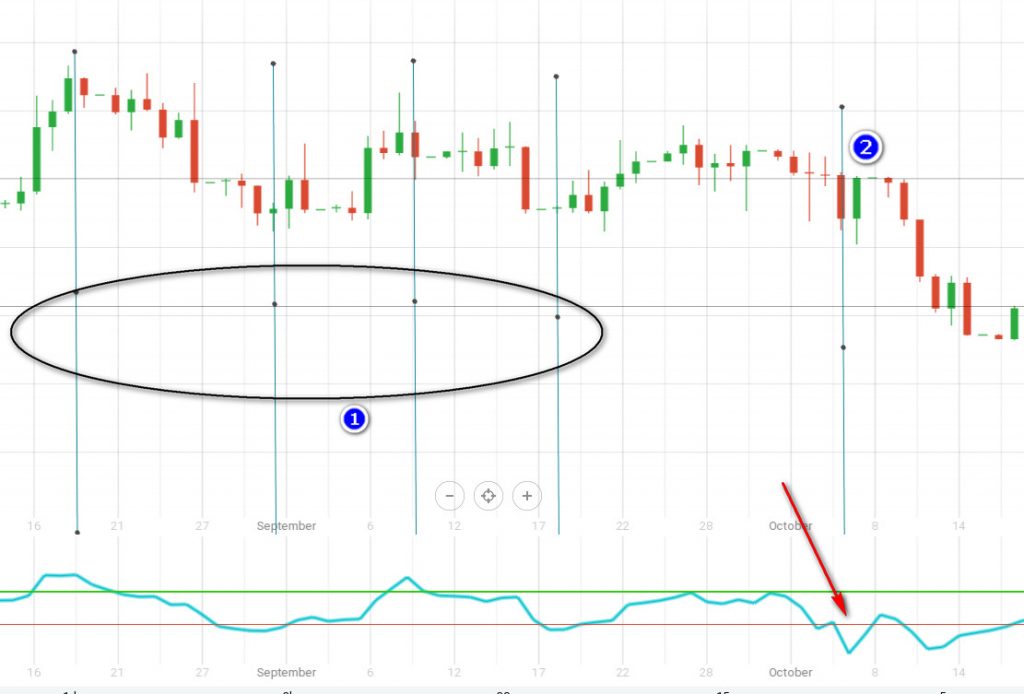
What is wrong in the fifth case? The problem is the type of indicator. It is an oscillator, a flat indicator that “folds” when a trend appears. As long as there are price fluctuations within a steady range, CCI detects reversals perfectly. As soon as the price of the asset gains momentum in a certain direction, false signals start.
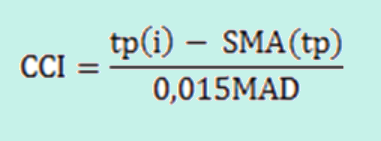
The CCI Formula
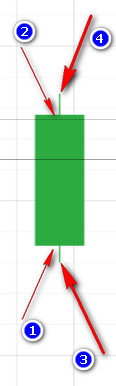
Let’s look at what’s under the hood in order to understand how to correctly use this indicator’s algorithm. If you start to panic when you see a mathematical formula, you can just skip to the next section. But it is useful to understand how this tool works so that you can get the most out of it. The stream of market transactions forms a candle with four price points: opening (1) and closing (2), and two extremes – the high (4) and low (3).
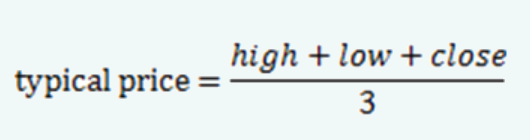
Donald Lambert used the average price of the extremes plus the closing price, and called it the typical price (tp):
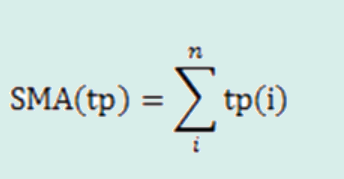
By making this calculation for each candle in the chosen period, we can get the average values using the simple moving average SMA(tp):
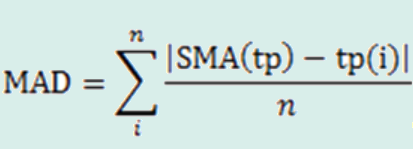
The task of determining the stable price channel is solved by averaging all ranges of deviations of the typical prices from their mean Moving Average Deviation (MAD). The deviations are taken in modulo (in absolute values).
 Once the problem of the channel has been solved, we just need to compare the position of the current deviation of the typical price:
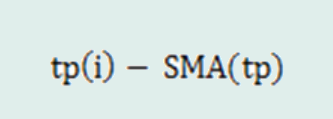
relative to the established MAD. But what will serve as a benchmark for the level of “normal” deviation?
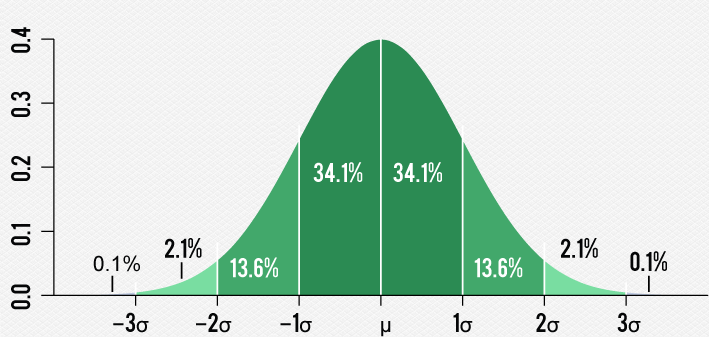
Donald Lambert chose a factor of 2/3, based on the probability density of normal distribution. We all remember the “three sigma rule.” There is a probability of 99.73% that random values lie within three deviations, and going outside 2 of them will cause correction. This is a general approach used in many indicators of this kind:
2/3 = 1/0.015, and the final CCI formula is as follows:
The levels that define the channel are taken as 100 (+100 is the upper limit and -100 is the lower limit). Just as for any oscillator, overbought and oversold levels are intrinsic to CCI. In a flat market, the price rarely leaves the channel.
How to Use CCI Indicator – Trading Strategies
There are two basic strategies for using CCI the oscillator: crossing the +100 and -100 levels.
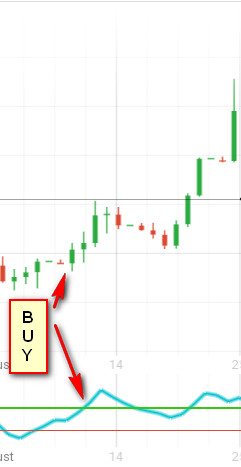
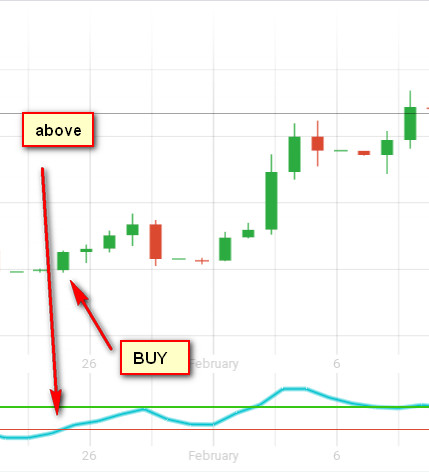
Buy the asset when the CCI line crosses +100:
Sell the asset when the CCI line crosses -100:
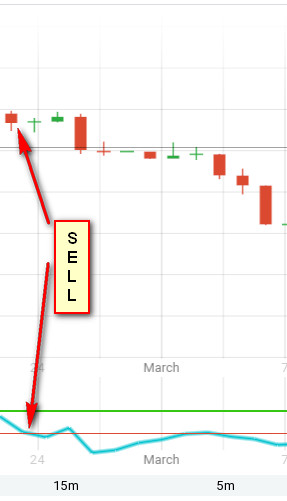
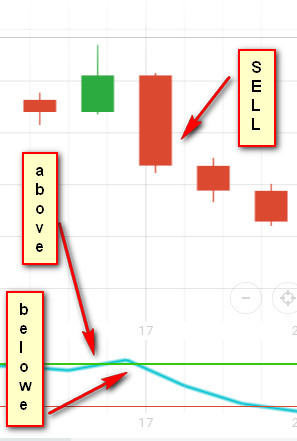
To trade in flat channels, open a deal when it crosses 100 and reverses back lower or higher than this level. The picture below shows what a CCI signal to sell looks like:
A method to buy in a flat channel looks like this: wait for the line crossing the -100 level, get ready to trade, and when it reverses and crosses the same level going up, it’s time to enter (buy the instrument).
CCI Strategy
There are break-even, trend, and counter-trend strategies to use CCI.
Break-even strategies haven’t lost their relevance due to the well-developed “step” approach for market-makers building a position.
How does it work? Each asset has firms that specializes in this instrument and trade in it continually on both sides of the market. Thanks to market-makers, any customer can buy or sell currencies 24 hours a day and always receive the “market price” without fail. Major financial institutions use the services of market-makers. A large amount of capital should enter the market gradually, so as not to raise or lower the entry price for itself. So flat market conditions might actually represent a building position. When the news hits the market, all the traders rush to trade on “that side”, while the market maker “gives away” their previously gained position in bits, and might even set up a new one at the peak of this movement.
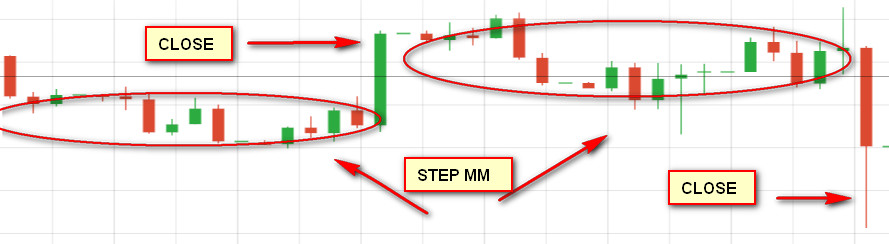
The market is presented as a series of flat sections of a set of positions, followed by the quotes rising to the “new level.”
Trading with the trend
A different approach insists on trading with the trend, assuming that even a bad entry that brings a loss will be “pulled out ahead” after the trend corrects.
The counter-trend strategy is most often used by scalpers, day traders with a large number of transactions (trading turbo options). By passing up the trend to avoid a chase, scalpers “catch” the correction using a counter-trend strategy.
To create a strategy, we need to have a number of primary and secondary indicators. Key indicators serve as signal “donors”. They are used for entering a trade on the asset (buy or sell). As mentioned earlier, all indicators have a certain number of false signals. When there are a lot of them, it is because an oscillator designed for trading in flat mode is used in a section with directional movement.
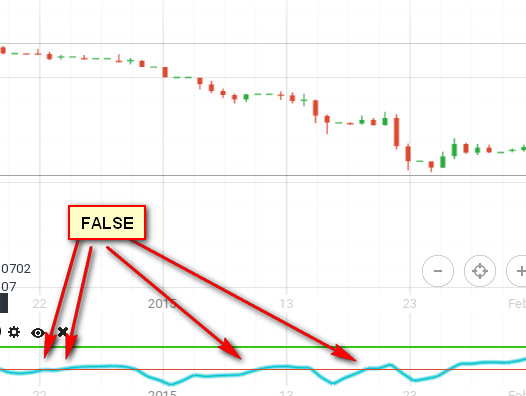
To filter out these signals, it would help to use a trend indicator, but this type of indicator also lies during sideways movement. So we need filters that determine whether there is a directional trend on the market or it’s flat.
CCI is ideal for creating a trading system because, as we’ve seen, the indicator’s algorithm gives entries both on a trend and on a flat. Our goal when creating a trading strategy is to select filters that detect the state of the market: flat or trend. Ideally, these additional filters would help us to include elements of counter-trend trades in our strategy.
Now that we’ve defined the concept of our strategy and set our objective with CCI as the signal donor, we can begin choosing filters for it.