Most Effective Way with Parabolic SAR
Parabolic SAR is a technical analysis indicator developed by Welles J. Wilder. It was first described in Wilder’s 1978 book, New Concepts in Technical Trading Systems. SAR stands for “stop and reverse”, it trails the price action as the time passes. The indicator is positioned below the price when the prices are soaring, and above the price when the prices are falling. The author himself called this indicator the “Parabolic Time/Price System.”
The indicator was developed with the purpose of notifying the trader about possible trend changes. Being a unique indicator with high practical potential, Parabolic SAR should nevertheless be combined with other indicators for maximum accuracy.
How does Parabolic SAR work?
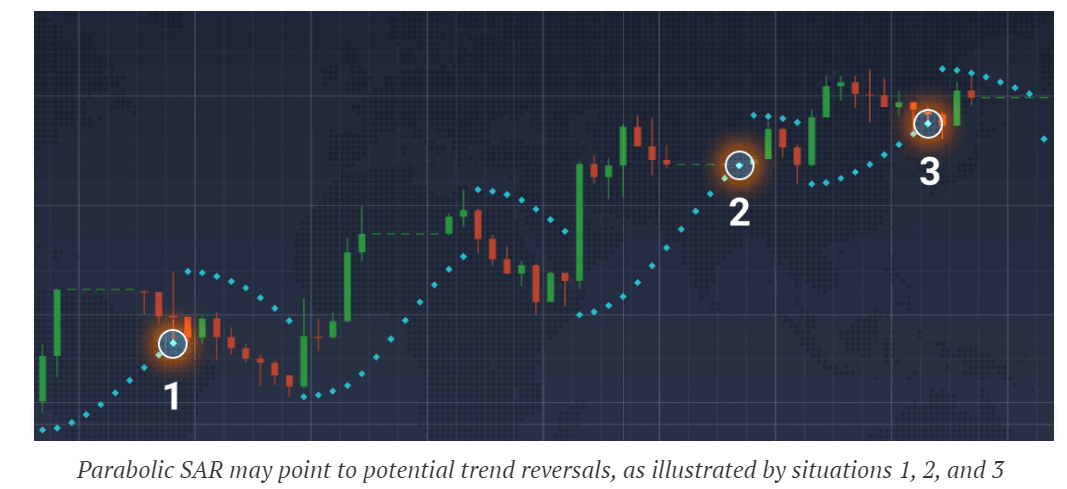
The idea behind the indicator is quite simple. When the price crosses one of Parabolic SAR dots, the indicator is expected to turn around and appear on the opposite side of the price line. Such behavior can be a signal of an upcoming trend reversal or at least a trend slowdown.
It can be seen in the picture above that when Parabolic SAR touches the price, the trend changes its direction. This risk-following indicator can be used to estimate optimal entry/exit points, predict the trend direction and forecast future behavior of the price action.
Settings for intraday trading
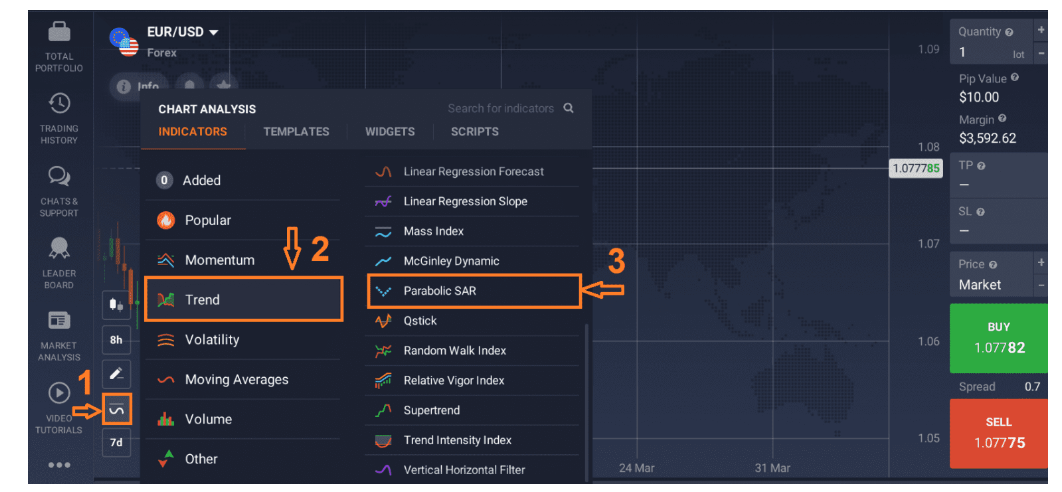
In order to use Parabolic SAR technical analysis indicator, do the following:
1. Click on the “Indicators” button in the bottom left corner of the screen,
2. Go to the “Popular” tab,
3. Choose Parabolic SAR from the list of possible indicators,
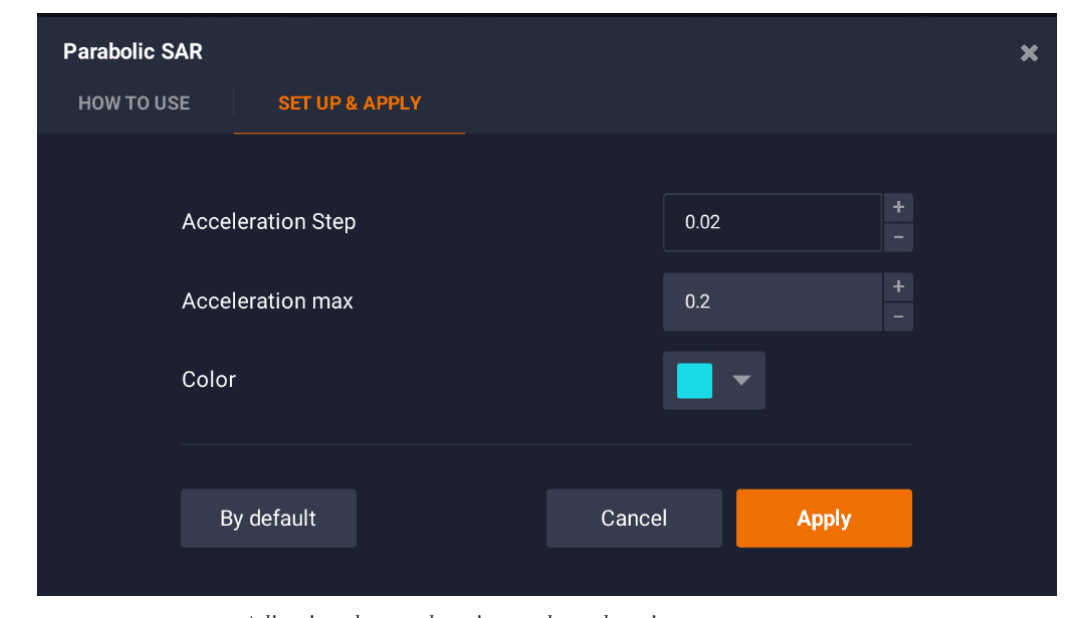
4. Click “Apply” if you want to use the indicator with standard parameters.
5. Or switch to the “Set Up & Apply” tab and configure the indicator according to your liking.
Traders can adjust two technical parameters in the “Set Up & Apply” tab, which are acceleration and acceleration max. By increasing the numbers, you can make the indicator more sensitive, at the same time sacrificing its precision.
The opposite effect can be achieved by lowering the values of acceleration and acceleration max: the indicator will become less sensitive but will also provide less false signals. Finding the right balance between accuracy and sensitivity is a prime task for traders interested in using Parabolic SAR in intraday trading.
How to use Parabolic SAR
According to Welles J. Wilder himself, the indicator should only be used during strong trends, that usually do not exceed 30% of the time. The use of Parabolic SAR on short time intervals and during the sideways movement is not advised as the indicator loses its predictive potential and can return false signals.
Professional traders often combine the use of Parabolic SAR with other indicators. One of the possible combinations — Parabolic SAR and Simple Moving Average — and its practical applications are described below. It is advised to double-check Parabolic SAR signals with the help of other indicators.
Parabolic SAR + SMA
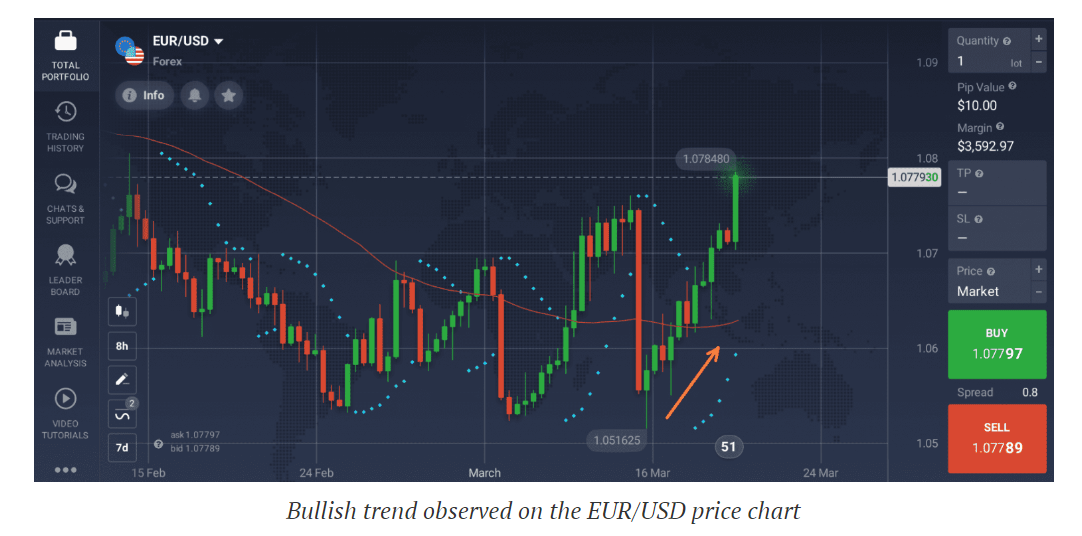
The combination of these two technical analysis tools is popular among experienced traders. Parabolic SAR (acceleration = 0.04, acceleration max = 0.4) and the SMA (period = 55) are used together to confirm each other’s signals. When using both indicators at the same time the traders are waiting for the following signals to appear:
Anticipating the bullish trend
When the price is below the SMA and Parabolic SAR demonstrates upward movement, the trend can be expected to become bullish.
Anticipating the bearish trend
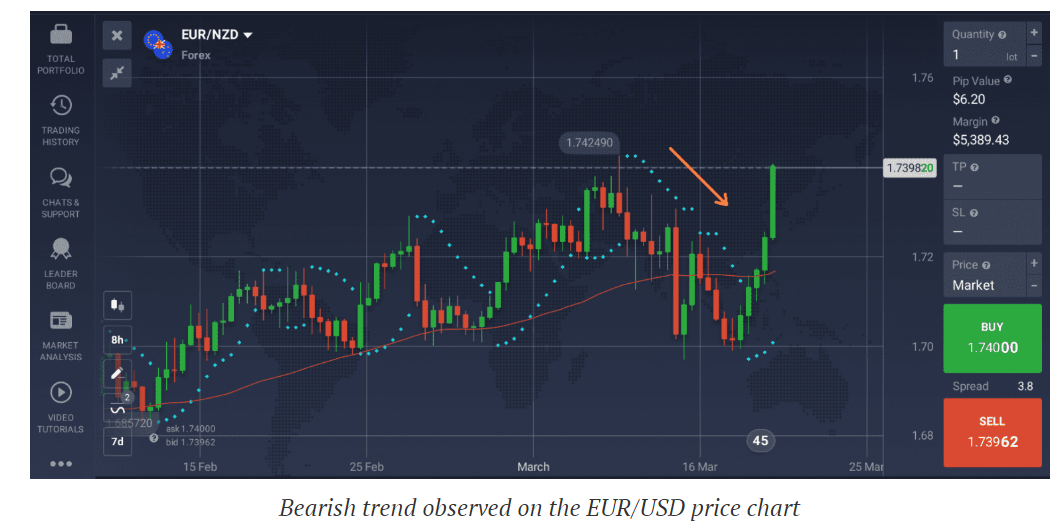
When the price is above the SMA and Parabolic SAR demonstrates downward movement, the trend can be expected to become bearish.
It is worth noting that no indicator can guarantee accurate signals 100% of the time . From time to time all indicators will provide false signals, and Parabolic SAR is not an exception. It is your work, as a trader, to tell true signals from false ones.
