Trading on Fibonacci levels
You’ve probably heard that the most effective trading tactic is trading in the direction of the trend, and the most optimal time for a transaction is during quote correction. In order to determine price reversal levels during correction, use the Fibonacci grid, a unique tool for technical analysis.
What is the Fibonacci grid
This instrument is based on the patterns of Fibonacci numbers, where each subsequent number is equal to the sum of the previous two (1, 1, 2, 3, 5, 8, 13, 21, and so on).
Using this mathematical series, you can determine the depth of quote correction and the size of future waves of price movement.
How does it work?
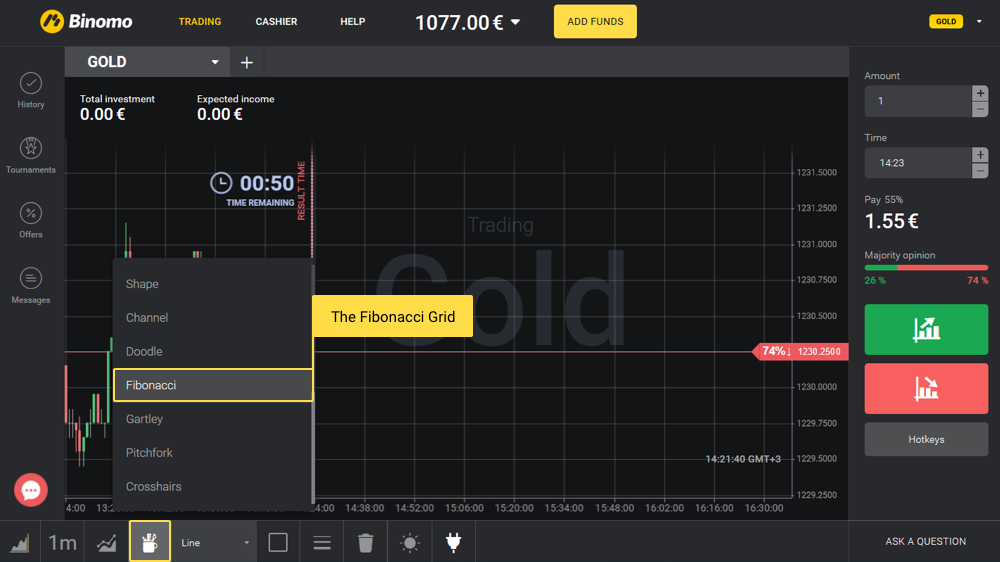
In the left corner of the Binomo platform, there is a chart tools selection tab. Select the Fibonacci grid:
Now imagine that asset quotes have been moving up for a time. Concluding a transaction on an increase would be unwise: it is likely that the quotes will reverse in the opposite direction for correction.
The optimal level for transactions on an increase is when correctional movement reverses again and continues the trend.
How to determine this level?
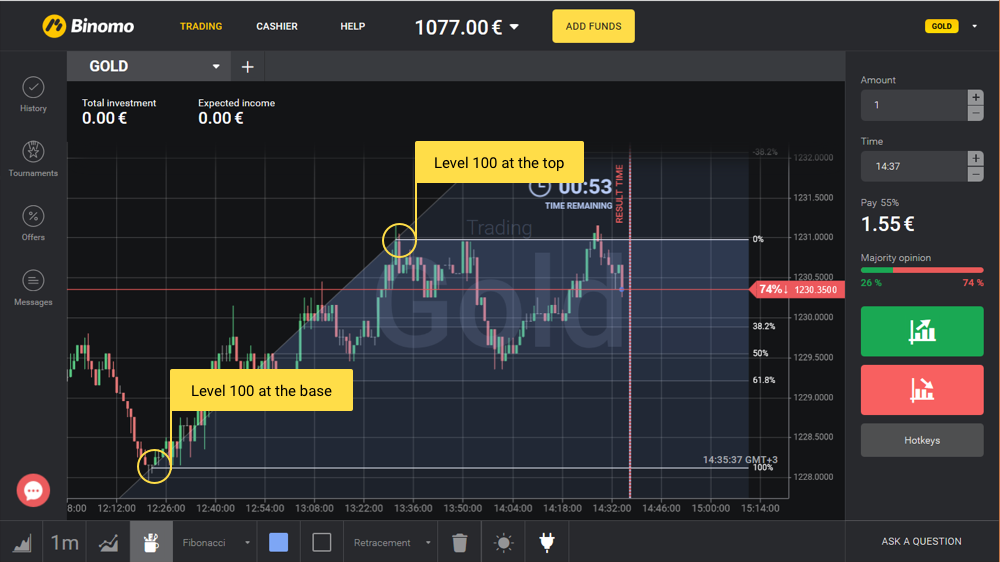
Apply to the quote chart the Fibonacci grid, the basis of which (level “0”) should be placed at the base of a growing trend, and the level of “100” should be on top of it:
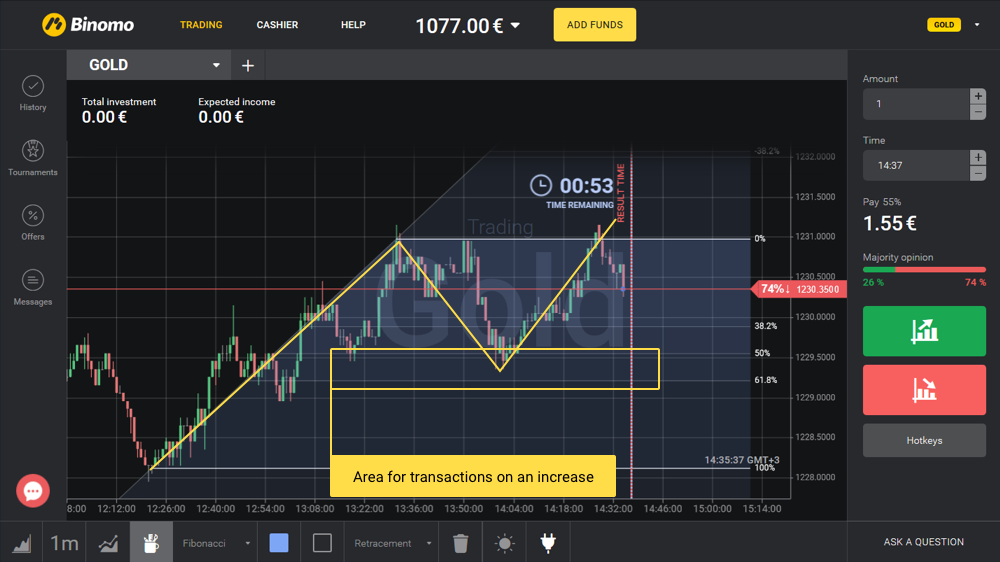
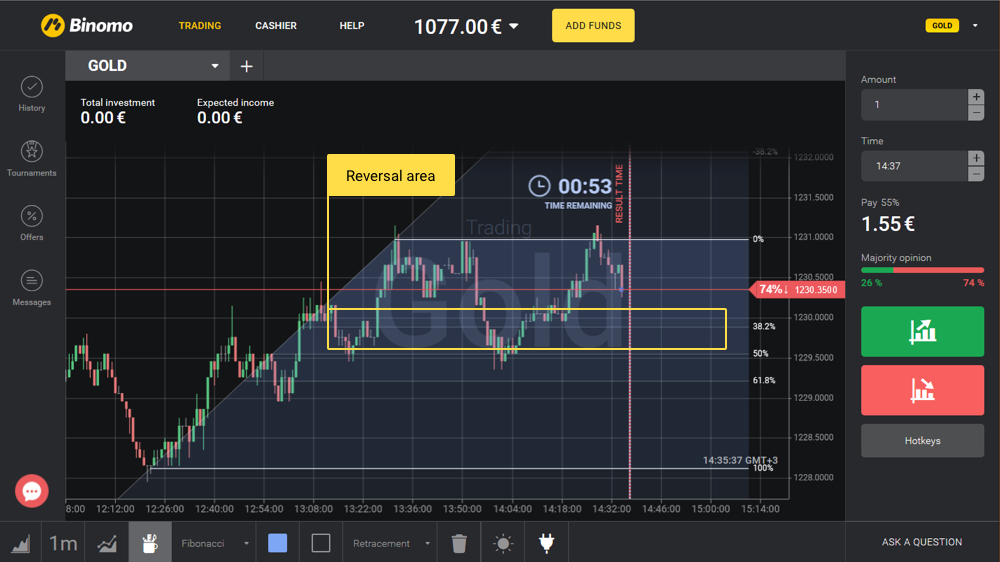
We now have clear guidelines: in most cases, quote reversal during correction takes place between the levels of 50% and 61.8%. Upon reaching this area, correction is likely to end and quotes will reverse to continue the trend:
The Fibonacci Grid works for downtrends as well, the height of correction of which is usually not more than 61.8% on the “Fibo” grid.


