How to use RSI indicator in trading?
Your capital may be at risk. This material is not an investment advice.
RSI Settings and Configurations
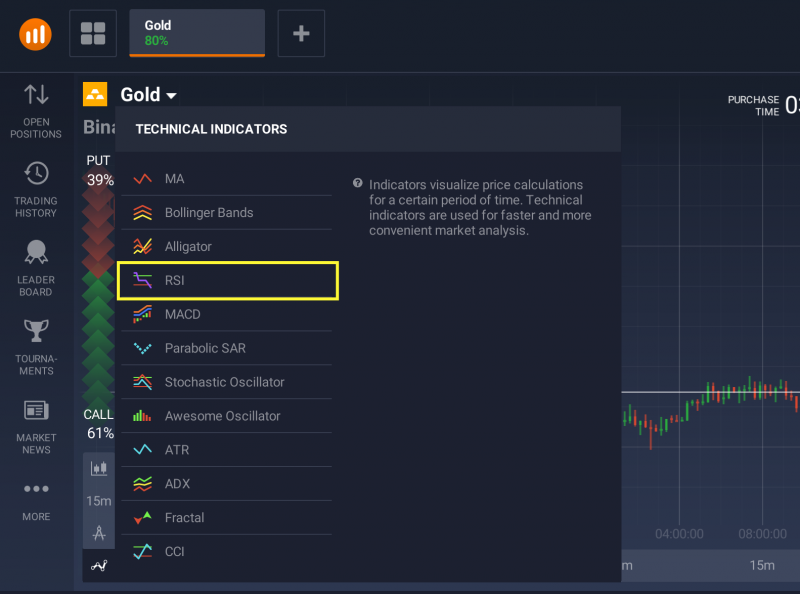
In order to use the relative strength index in IQ Option trading platform, click on the “Indicators” button in the lower left corner of the screen. Choose “RSI” from the list of possible indicators.

Then simply click the “Apply” button if you prefer standard settings. The RSI graph will appear in the bottom part of your screen.
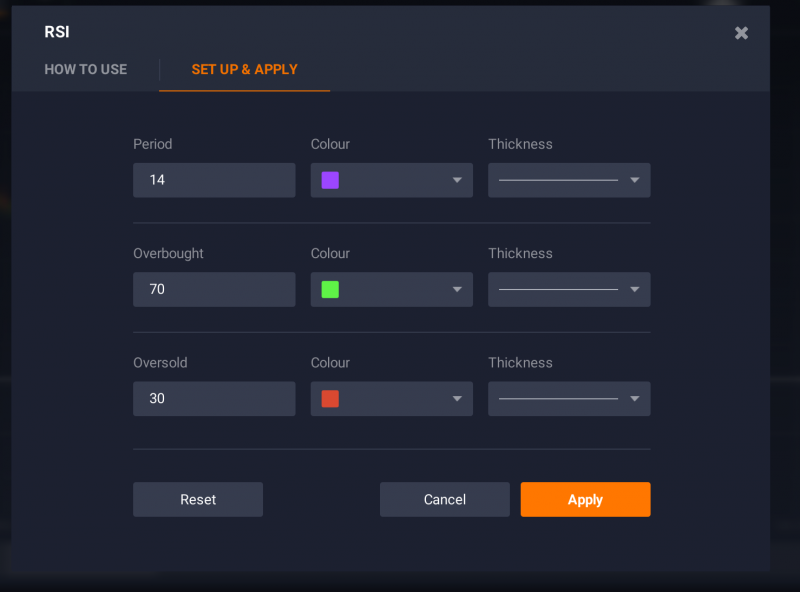
For expert traders we could recommend taking one more additional step and going to the “Set up & Apply” tab.
Choose the RSI settings: the period of your liking, as well as overbought and oversold levels for more sensitivity/accuracy. Remember that the wider the corridor the fewer signals you get, but at the same time they will be more accurate. The opposite is the case if the threshold levels are closer to each other: the crossover signals will appear more often, but the number of false alarms will also increase. Remember that by increasing the “Period” parameter you are making the indicator less sensitive.

Standard approach – 70/30
The smoothing period of 14, oversold level 30% and overbought level 70% are used in the standard approach. This is the most frequently used preset for this indicator. Traders expect the RSI to bounce from 30 and 70 threshold lines. With standard parameters it will happen quite often, but it won’t always mean the actual change in the trend direction is coming.
Conservative approach – 80/20
The smoothing period of 21, oversold level 20% and overbought level 80% are advised by the conservative approach advocates. Risk-averse investors set up the indicator in a way that will make the RSI less sensitive and therefore minimise the number of incorrect signals. More extreme high and low levels — 90 and 10 — occur less frequently but indicate stronger momentum.
Divergence
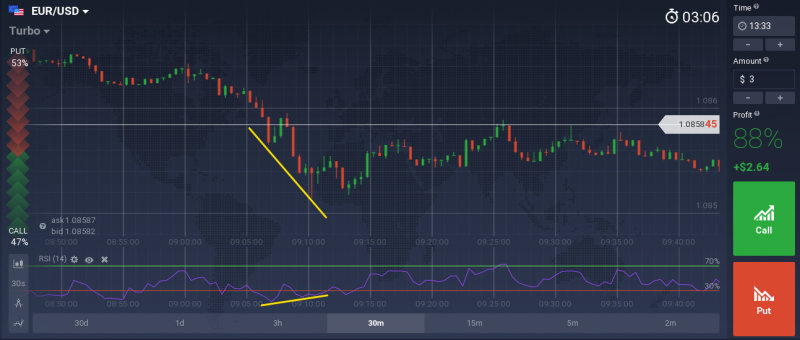
Divergence is another way to use the above-mentioned indicator. If the movement of the underlying prices is not confirmed by the RSI it can signal a trend shift.

Divergence can be a good indicator of a coming price reversal. In the example above the price of the asset goes down, while the RSI demonstrates the opposite movement. This situation is followed by the trend shift.
Conclusion
The RSI is a powerful tool that can tell traders when to buy and when to sell. Sometimes it can also predict the trend other indicators are too slow to acknowledge. However, it is rarely used on its own and is recommended to be combined with other indicators. The RSI can be combined with other indicators for increased accuracy and efficiency.


