“Fractal Turn” Strategy
Bill Williams is a famous billionaire and trader who invented the trading system and a set of technical indicators, which in due time became a sensation in the world of trading. We have talked before about one of his indicators called the “Alligator”. Now it’s time to study the “Fractals” indicator. We are sure that this will bring you more profitable transactions!
What are Bill Williams’ Fractals?
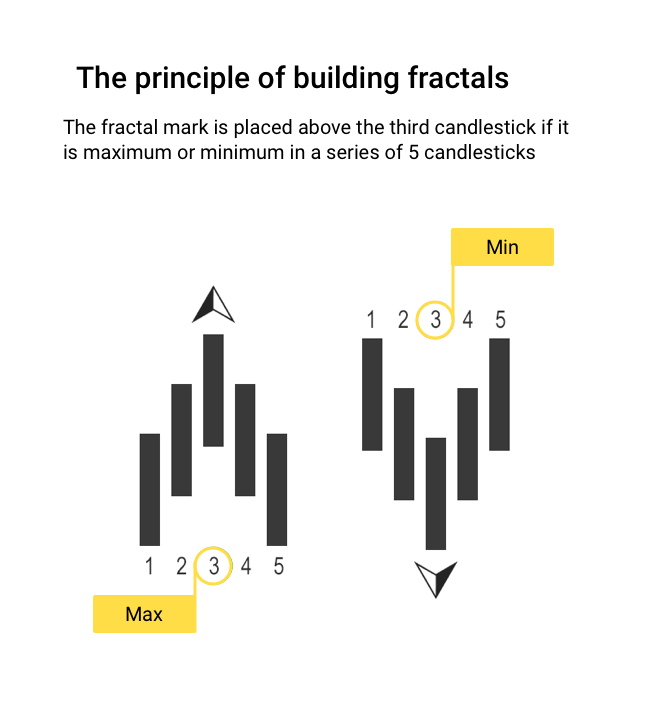
Fractals are local maxima or minima, which are formed on the chart during the wave price movement.
Fractal is a formation of five candlesticks (or bars) in which the third candlestick always has the highest maximum or the lowest minimum compared to the others:
According Bill Williams’ theory, it is not necessary to outline exactly 5 candlesticks, but this number is most popular among traders, so we use it by default.
Thus, when analyzing the sequence of candlesticks appearing on the chart, the fractal indicator marks the highest and lowest candlesticks in the series, thereby determining the local maxima and minima of the price chart.
How do you make money using fractals?
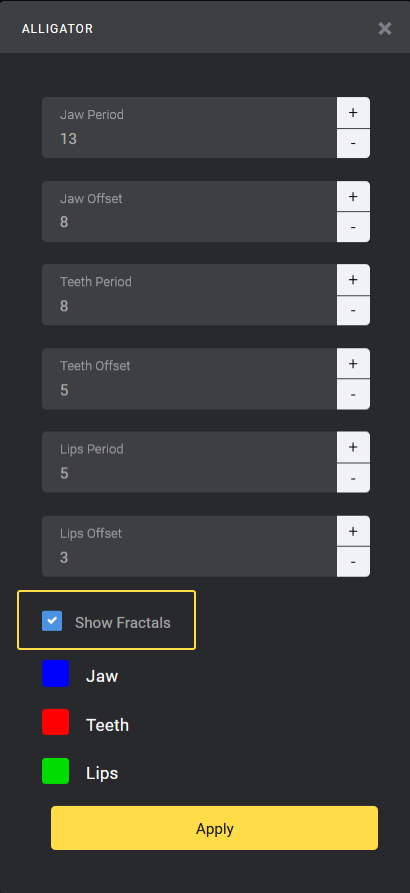
Select the Alligator indicator with the default settings at the Binomo platform and tick the “Show Fractals” option:
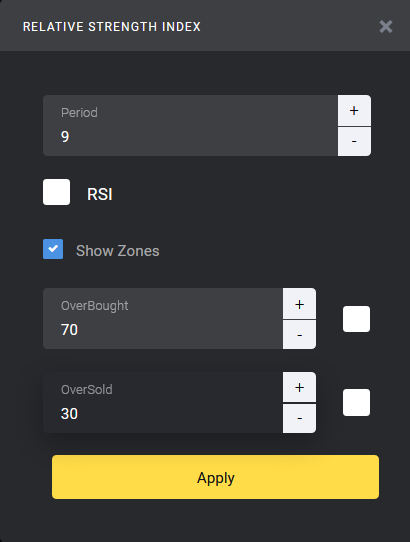
Then, select the RSI indicator and set the following parameters:
- Length – 9
- Overbought level – 70
- Oversold level – 30
Each of the indicators chosen for this strategy has its own important function:
- The Fractals indicator shows local minima and maxima, by which we can determine the beginning and the end of each new wave of price growth and reduction.
- The RSI indicator gives a signal that the price has reached the overbought/oversold levels, where the quotes most often unfold in the opposite direction.
- The Alligator indicator may be used as a trend filter, which shows the moments of the beginning of a new trend in the asset market.
To analyze the price chart, it is necessary to use a 1M time frame, on which the listed indicators will give more accurate signals than on the lower time frames.
Trading signals used for the strategy and transaction rules
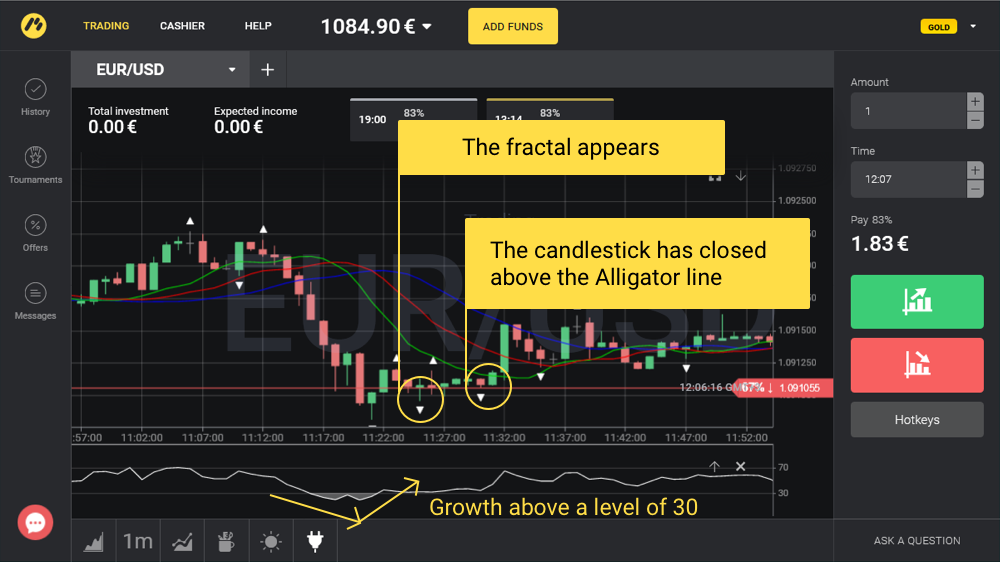
To conclude an upwards transaction, the following situation should be on the price chart:
- The RSI indicator has fallen below the oversold level of 30 and crossed it back upwards, giving a signal of a possible upwards price turn
- On the price chart, a lower fractal (below the price level) has been formed
- The quotes have crossed the green line of the Alligator indicator and the “breakdown” candlestick closed above the indicator line
To conclude a downwards transaction, the following situation should be on the price chart:
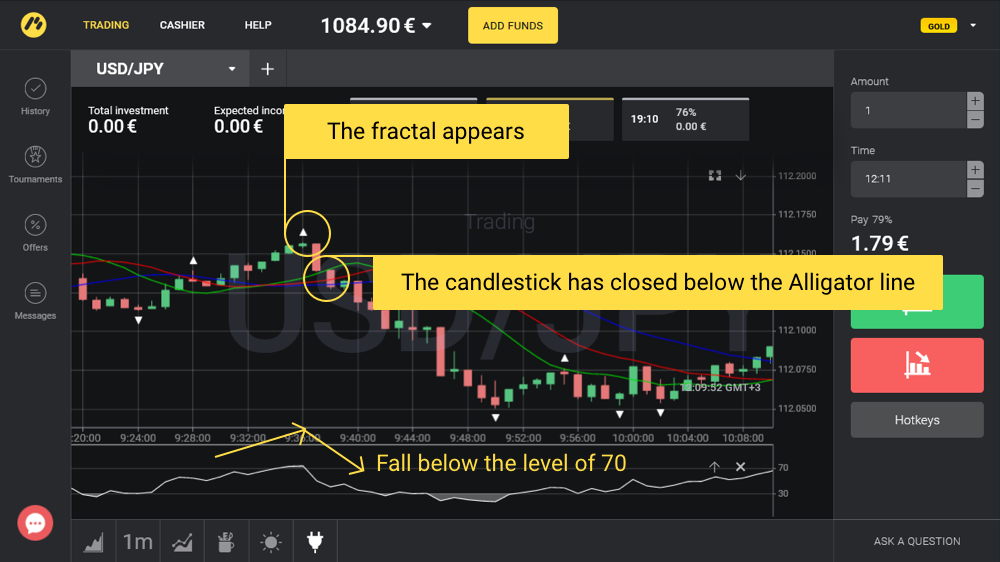
- The RSI indicator has risen above the overbought level of 70 and crossed it back downwards, giving a signal of a possible downwards price turn.
- On the price chart, an upper fractal (above the price level) has been formed.
- The quotes have crossed the green line of the Alligator indicator and the “breakdown” candlestick closed below the indicator line.
Risk management
This strategy requires strict compliance with risk management requirements. By using no more than 3% of the funds available on your account for making transaction, you will significantly reduce the trading drawdown and the overall risk of losing your funds.
Expiration period
Considering that for the analysis of the price chart we chose the older time frame at the Binomo platform (namely, 1M), so the expiration period of transactions will be longer, namely 5–10 minutes.
NOTE: This article/material is not an investment advice.

