Five best indicators for binary options trading
All binary options indicators are categorized into the following types. It is therefore important to understand the types of indicators rather than focus on tons of endless indicators that promise to make you rich.
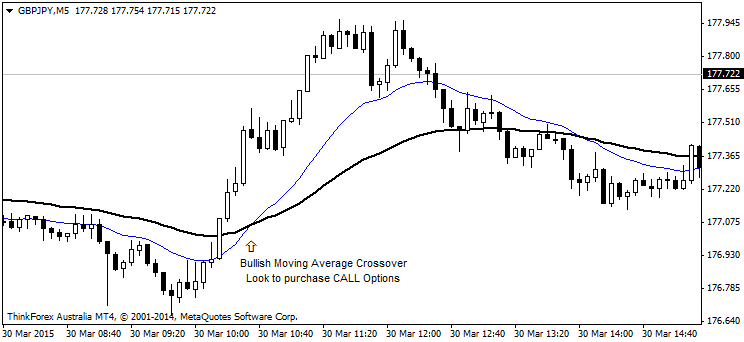
- Moving Average: The Moving Average indicator is probably one of the best trend based indicator that is available. It is flexible as it allows traders a lot of modifications such as setting the period to Close or Open, High or Low as well as changing the period and not to forget the different moving averages such as Simple, Exponential, Linear Weighted and Smoothed.You will use a moving average indicator for binary options trading, primarily to figure out the trend in the prices. If the prices are above the moving average, it indicates that the price is in an uptrend and vice versa. Also pay attention to the slope of the moving average as it usually signals a strong trend.
Figure 1: Binary Options Indicator: Moving Average/Trend
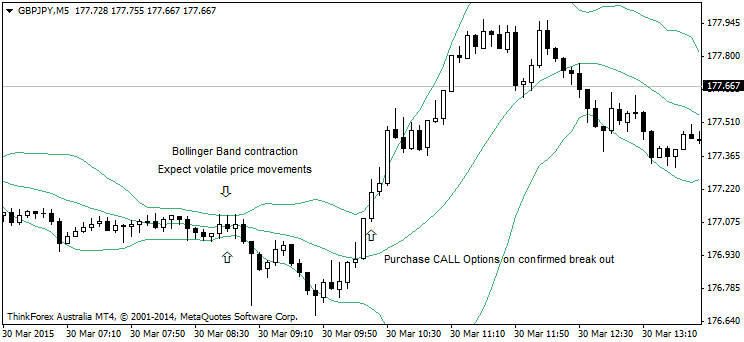
- Bollinger Bands: Bollinger Bands are versatile as the bands are squeezed and expanded based on the impending market volatility. You will use Bollinger Bands to capture break outs or for trading high momentum markets, example, before a major news release, Bollinger Bands tend to contract indicating a volatile move in the markets is approaching. The mid Bollinger Band is nothing but a moving average, so this indicator gives you two-in-one: Trend and Volatility
Figure 2: Volatility Break out Binary options Indicator
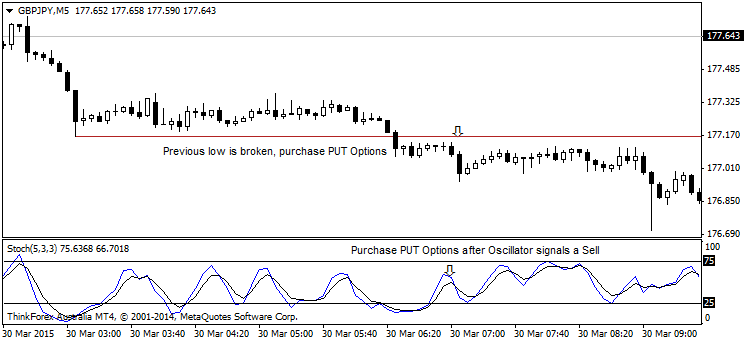
- Stochastics Oscillator: The Stochastics oscillator is a great indicator to use especially when you notice that prices are moving within a range. Besides using the Stochastics oscillator for just trading the sideways price action, it can also be used to identify retracements within the trend by simply following the oscillator when it crosses above or below 80 and 20 levels. You should ideally use the Stochastics oscillator alongside a trend or a volatility based indicator
Figure 3: Binary Options Indicators: Oscillators
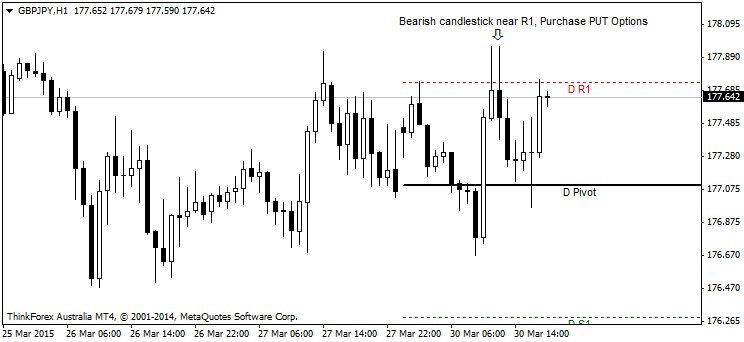
- Pivot Points: Pivot points are a trading tool and they technically fall into the category of an ‘Indicator’ Pivot points basically calculate and give you 7 price levels based on the Open/High/Low and close from the previous day. The mid line is noted as the Pivot point followed by 3 resistance lines drawn above the pivot and 3 support lines drawn below the pivot midpoint. When price reaches the extreme support or resistance level, termed S3 or R3, it indicates either a continued trend or a reversal. Conversely, when price fails to reach the first support or resistance level, it indicates a potential reversal in the trend.
Figure 4: Binary Options Indicators – Pivot Points
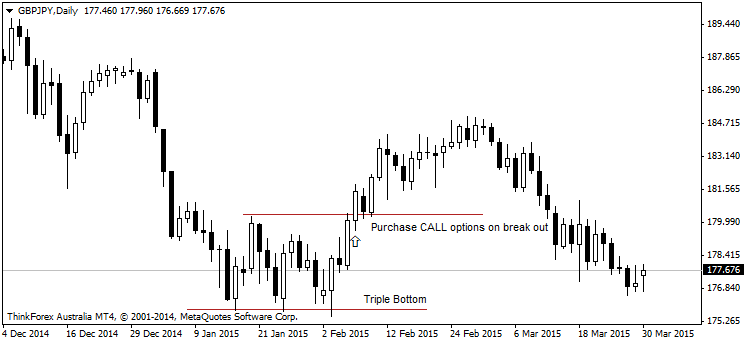
- Price Action: Price action is probably the least understood and most confused trading concept. It is not an indicator but is an important tool for binary options traders and normal traders alike. Price action combines the use of candlestick patterns, support and resistance and chart patterns. It is not usually suited for the beginner of traders, but having an understanding of price action makes an important addition to your trading success. Price action is an entirely different school of study that requires a lot of time and experience putting it into practice. The added advantage with price action trading is that it compliments any indicator based trading strategy.
Figure 5: Binary Options Indicators – Price Action Trading
