Strategy with candle patterns
In candle analysis there are “Evening Star” and “Morning Star” patterns. They are widely known because they accurately indicate the time of reversal. And the “Stars” on the chart meet quite often and it’s easy to make them out. We will now teach you how.
Looking for the “Morning Star”
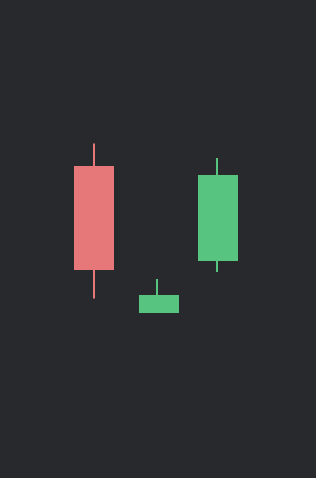
It is not formed in the mornings, but simply in a bearish (falling) trend: after a red candle, another one with a short body appears. The short candle can be green or red, it’s not so important. But the opening and closing should be lower than the previous one’s minimum! The larger the gap, the stronger the signal.
Following the short candle, a new long green candle will be formed. This is a signal that the quotes have reversed upwards and the price will rise.
To summarize:
- Falling trend
- A short candle appears after a long red one
- The level of closing and opening of the short candle is significantly lower than that of the one before it
- The short candle is followed by a long green one
Here’s what the “Morning Star” looks like:
Looking for the “Evening Star”
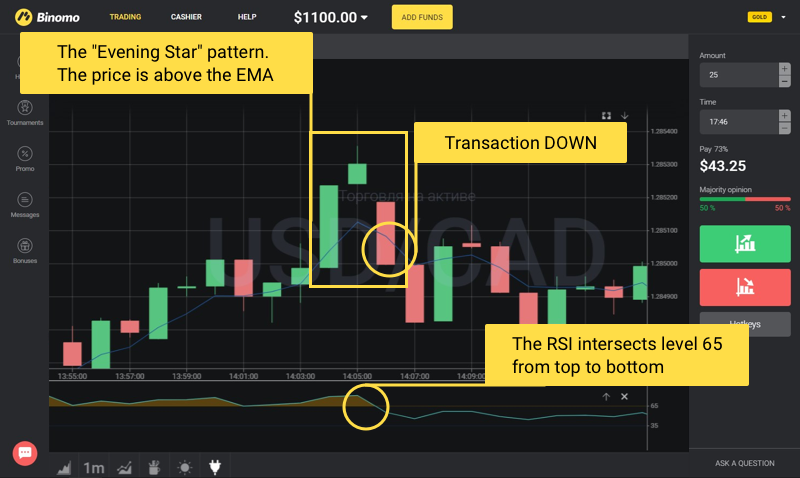
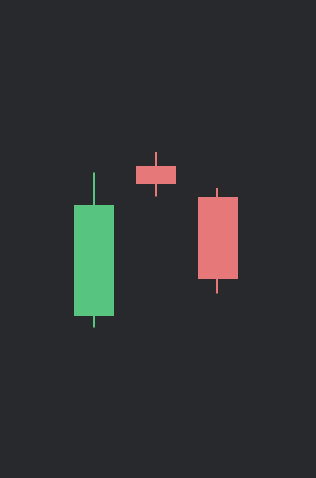
It is exactly the opposite. On an upward trend, a short candle appears after a long green one. The price of opening and closing of the short candle is significantly higher than that of the previous green one. A long red candle is formed after them, and it is 2-3 times the size of the short candle.
So, the signs of the “Evening Star”:
- Growing trend
- A short candle appears after a long green one
- The level of closing and opening of the short candle is significantly higher than that of the one before it
- The short candle is followed by a long red one
Here’s what the “Evening Star” looks like:
Ideally, there will be a price gap in the pattern both before and after the short candle. But in reality this is rare.
Setting up the trading template
- Time frame from 15s to 1m
- Moving Average (MA) with a period of 5, type Exponential
- RSI with a period of 8, levels of 65 and 35
- Transactions are opened for 3-15 minutes, depending on the selected time frame. The longer the time frame, the longer the transaction expiration
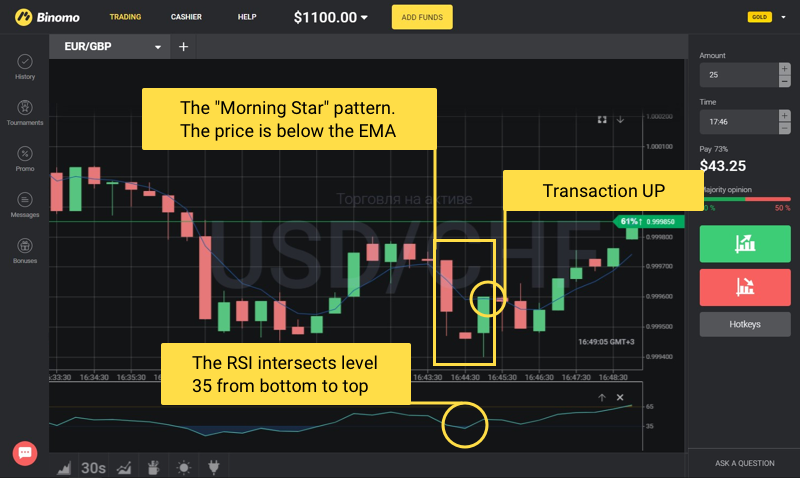
Conditions for transactions UP
- The price is below the EMA – falling trend
- The “Morning Star” pattern has formed
- The RSI intersects level 35 from bottom to top on the final and 3rd “Star” candle
Conditions for transactions DOWN
- The price is above the EMA – growing trendд
- The “Evening Star” pattern has formed
- The RSI intersects level 65 from top to bottom on the final and 3rd “Star” candle
Important recommendations
The strategy is suitable for any asset and time of day, but it is not recommended for use when important macroeconomic news is being released.
Always test out a new strategy on the demo account until you are sure that it suits you.
Observe the rules of money management: determine your maximum profit and loss in advance, and do not enter into transactions with amounts exceeding 3-5% of your account balance!


