Belkhayate Timing indicator
It is an oscillator that was designed by Mustapha Belkhayate to calculate the center of the market movement gravity. It helps to identify favorable areas for buying/selling (moments to enter the market) and possible reversal points.
Traders often use it combined with the channel indicators (Bollinger Bands, Belkhayate Barycenter, Fractals etc).

What to look at?
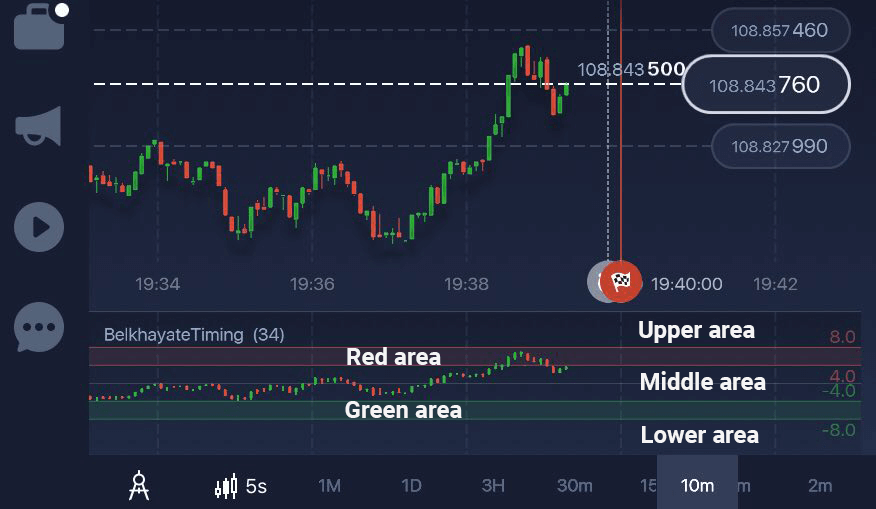
This indicator has three areas. Let’s clarify what each area of the indicator demonstrates.
1) Middle area (a neutral zone):
When the price is in this area, it is not recommended to enter the market. The probability of your decision being correct (or wrong) is 50/50.
2) Red and Green areas (extreme zones):
These areas indicate areas to enter the market. The red zone indicates the price decrease. The green zone indicates the price increase.
The red area: a possible signal to sell. The green area: a possible signal to buy.
3) Upper and lower areas (transparent) beyond extreme areas:
These areas serve as warning zones, they issue the buying and selling signals with a higher probability.
To sum it up, Belkhayate Timing is similar to the Stochastic and RSI indicators. Indicator values range from 0 to 100 (10 to -10). Often traders consider the entry to be valid when the indicator lies between the lines 4 and 8 (-4 and -8). The closer it is to 8/-8, or even if it goes beyond that level, the stronger the signal is for selling or buying.


