The Racer strategy for turbo binary options.
Your capital may be at risk. This material is not an investment advice.
Options of the Turbo type can significantly reduce the time for trading and increase the profit factor of your trading activity. After all, a profit can be made with the help of these short-term contracts every 60 seconds!
The only thing left to do is learn how to determine in which direction the price will move in the next minute – up or down. This new Racer strategy will help.
The set of indicators for trading on the strategy
The Racer strategy for turbo options uses three technical indicators that are on the Binomo platform:
- The moving average – it shows the main direction of price movement
- RSI – it shows the strength of price changes
- MACD – it gives us timely signals about changes in trend directions
Indicator settings
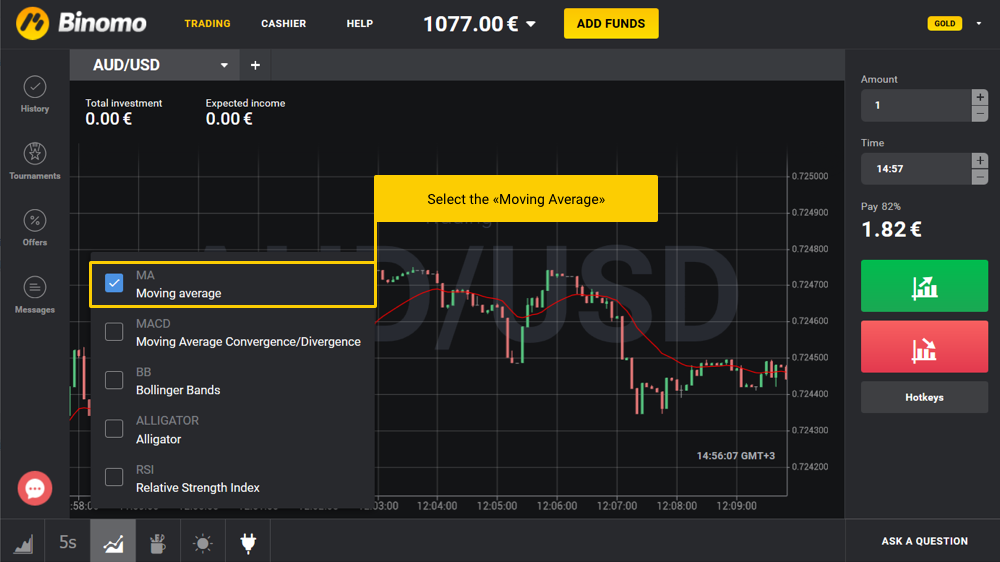
Click on the appropriate button in the lower left corner of the Binomo platform and alternately adjust the indicators as follows:
Select the “Moving Average”:
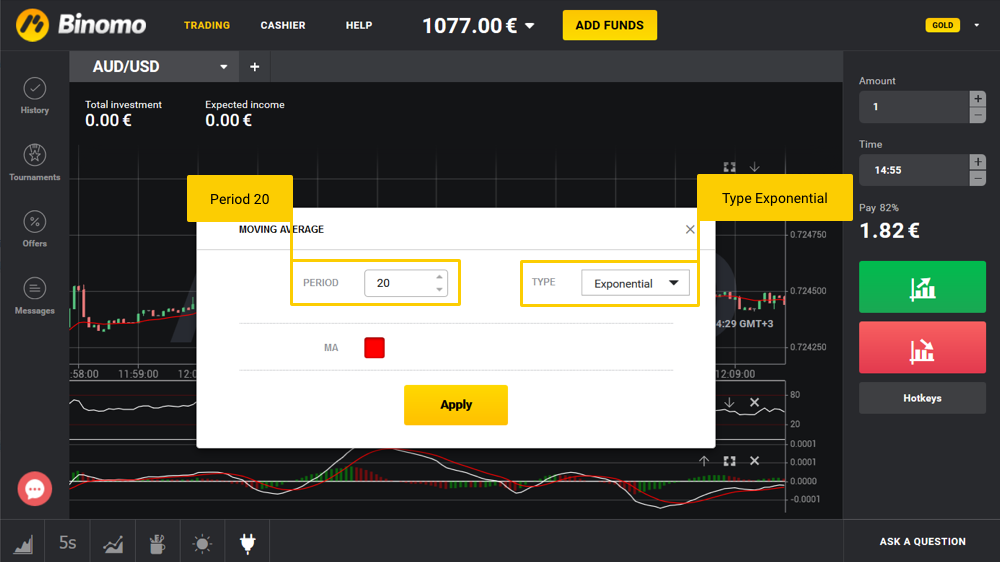
Apply this indicator to the quote chart with the following parameters:
- period 20
- type – Exponential
Select and apply the MACD and RSI indicators with standard settings values to the quote chart:
After building the trading template, you can proceed to analyzing the price chart and concluding transactions.
How to trade on the Racer strategy
The main advantage of the Racer strategy is the timeliness of its trading signals, which provides the trader with a system for concluding transactions in the right direction.
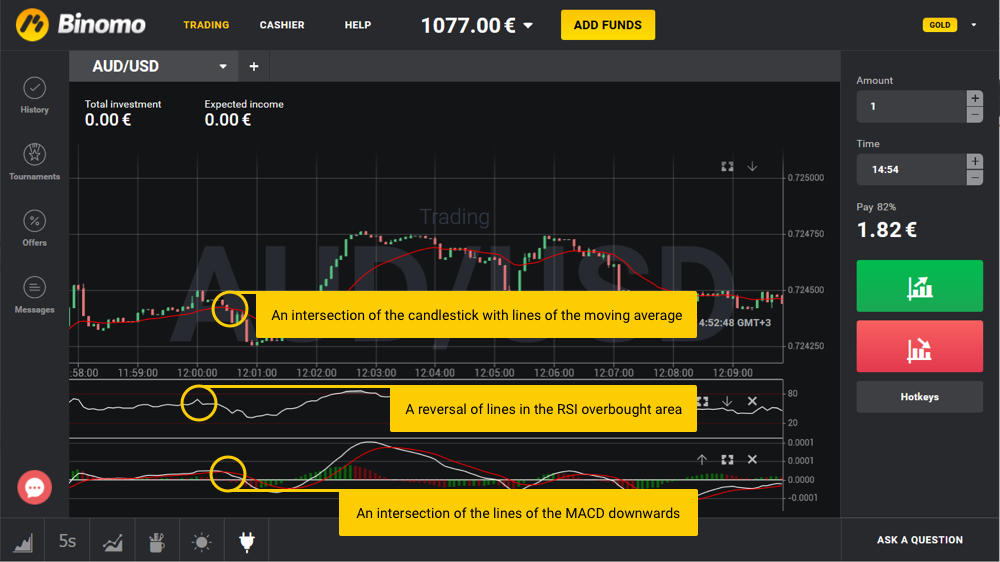
Transactions on a price reduction should be concluded if the indicators all together, or with small intervals between them, provide the following signals:
- The RSI indicator line grows to the “overbought” area (above the upper line of the indicator scale), and starts to decline in the opposite direction. This suggests that the quotes have reached their peak growth values and a break in the local trend will soon begin.
- The slow and fast lines of the MACD indicator intersect downwards. This means that a downward price reversal is possible on the asset market.
- Candlestick quotes intersect the line of the moving average downwards. Most likely, there is currently a trend change on the asset price chart downwards:
As soon as any such indicator signals appear on your price chart, you should conclude transactions on a reduction, since, in most cases, the asset quotes will soon begin to decline.
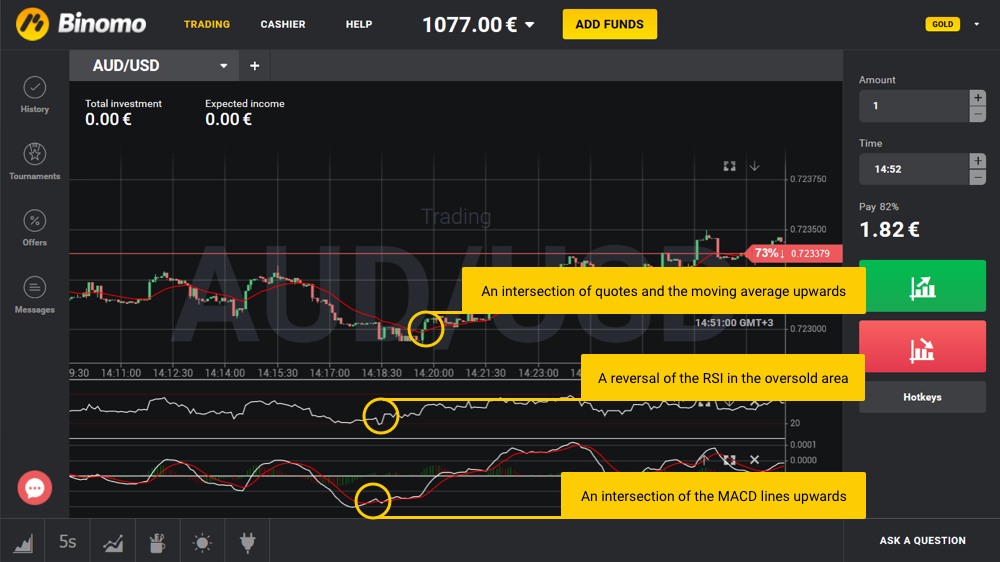
Transactions on a rise in asset price should be concluded after the following signals are provided:
- The RSI indicator line falls to the “oversold” area (under the lower line of the indicator scale) and reverses back up.
- The slow and fast lines of the MACD indicator intersect in an upward direction.
- Candlestick quotes intersect the line of the moving average upwards.
This situation on the asset price chart suggests that, most likely, active price growth will begin and now is the best time to conclude transactions on a rise.
Expiration terms. Money management
Use the time interval of 1-2 minutes, during which trading asset quotes move in the direction specified by the indicators.
The Racer strategy for turbo options requires greater control over the management of trading capital. To trade with the optimum ratio of profitability and risk, use no more than 2% of the amount in your account to conclude each transaction.


