The “Elder’s Triple Screen” strategy
Many different trading strategies and tactics are used on the financial market. “Elder’s Triple Screen” is considered one of the most effective and simple to use. Using this system, you will always trade in the direction of main market trends and figure out the best time to conclude transactions.
How does the principle of “Triple Screen” work?
The main advantage and difference of this strategy from others is the use of multiple timeframes for market analysis.
- You analyze the global trend on the oldest timeframe (5 min) to conclude transactions only in that direction.
- On a younger timeframe (1 min), you track the start of new waves of growth and decline.
- The youngest timeframe (5 sec) is used directly for the conclusion of profitable transactions.
Everything is very well thought out in this strategy. Now you will learn how to use it!
For reference. Alexander Elder, whose name is in the strategy, is its inventor and one of the most famous traders of our time. He wrote a number of manuals on stock trading that have become bestsellers, as well as reference books for many traders. If you’re looking for something to read, be sure to take a look at his books!
The creation and principles of the trading template
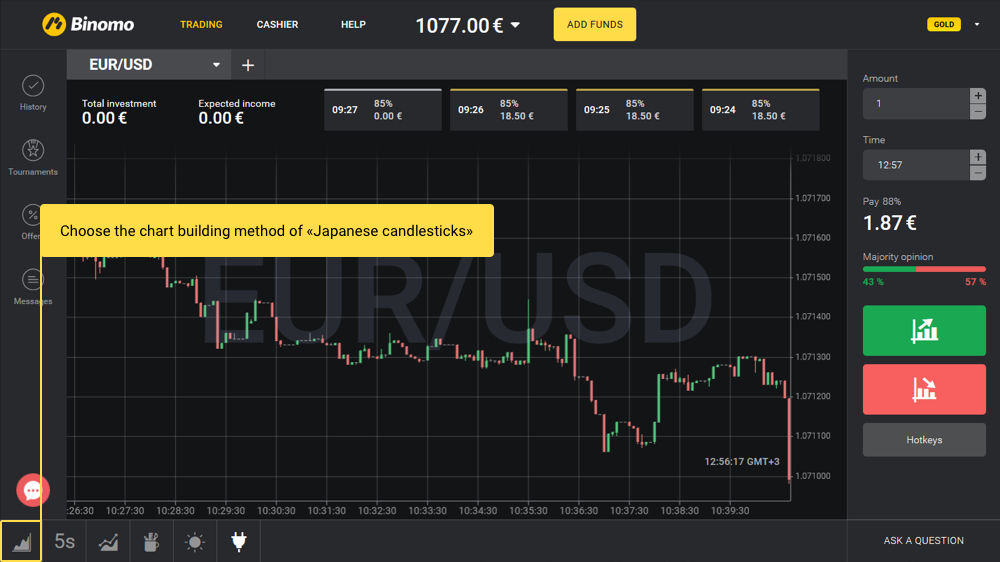
So, to trade on this strategy, select any of the trading assets from the Binomo platform and specify the method of chart building called “Japanese candlesticks”:
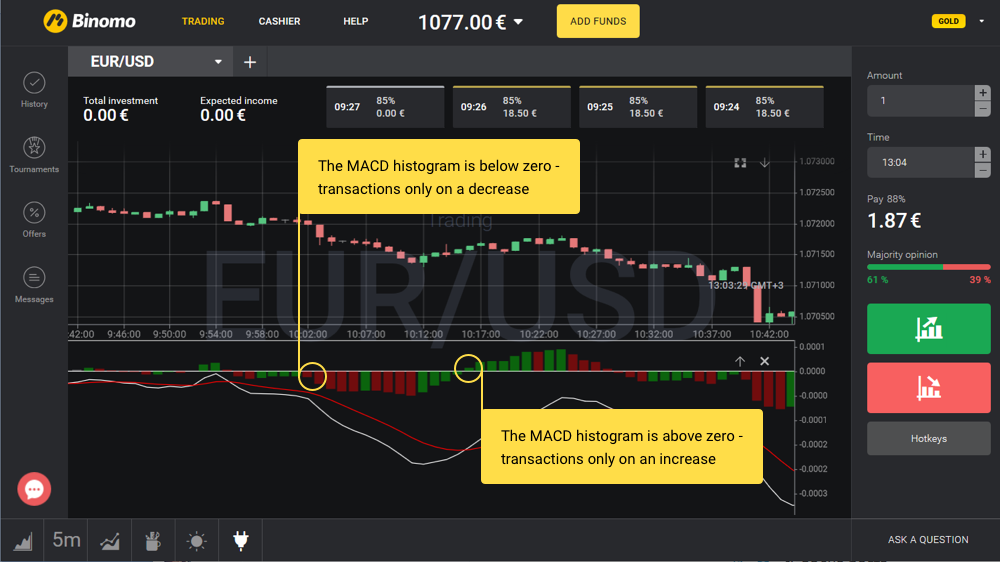
For the first window, select the 5 min timeframe to identify the main market trends. On this quote chart apply the MACD technical indicator in the default settings.
The MACD indicator will show you the main direction of the trend:
- If the indicator’s histogram columns are located above the zero scale level, there is a growing trend on the market and transactions may be concluded only on an increase
- If the indicator’s histogram columns are located below the zero scale level, there is a declining trend on the market and transactions may be concluded only on a decrease
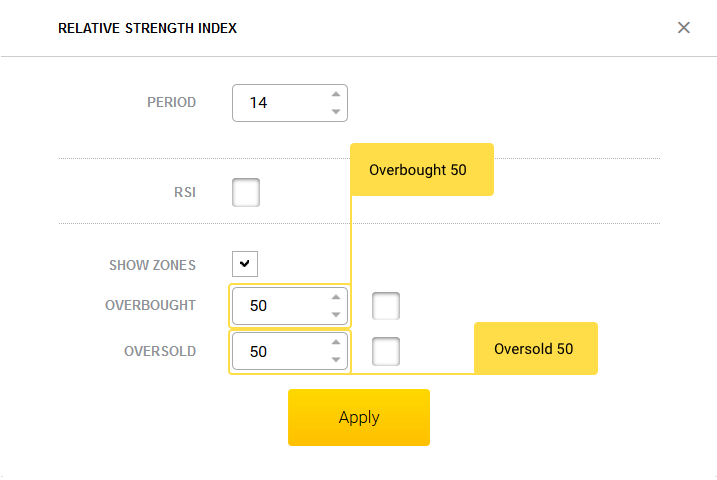
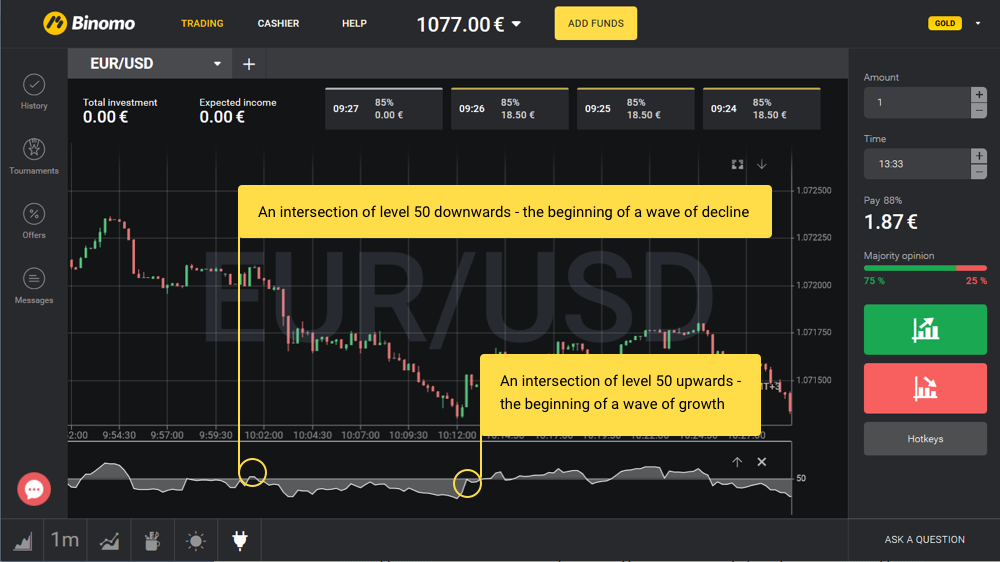
For the second window, select the 1 min timeframe. To this quote chart, apply the RSI indicator with the default settings, and change the overbought/oversold levels to 50/50:
In this window we can analyze the beginning of new waves of growth and decline:
- If the RSI line intersects level 50 upwards – a wave of growth begins
- If the RSI line intersects level 50 downwards – a wave of decline begins
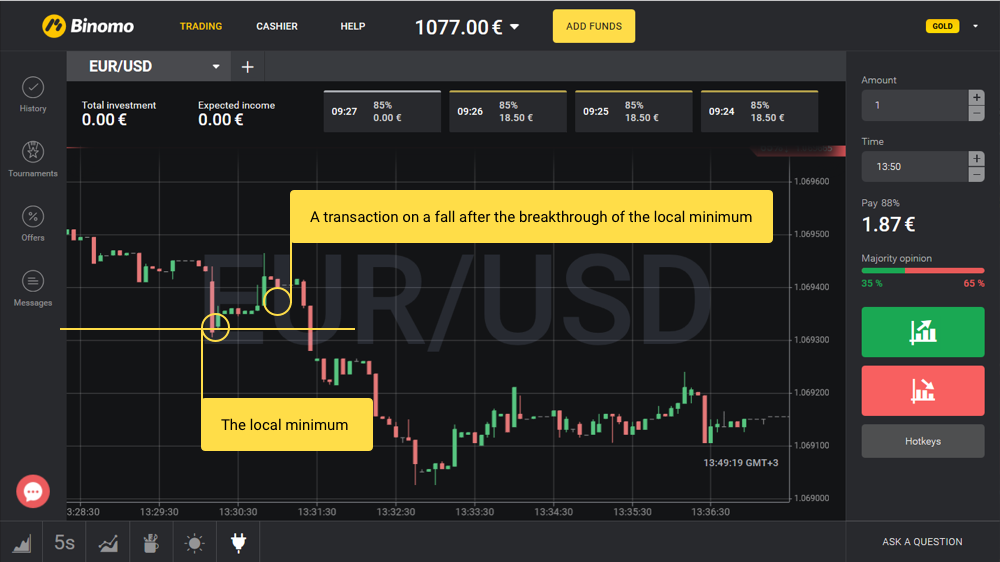
For the third screen, you must select the 5 sec timeframe. This is the window where transactions will be concluded.
How to trade on the “Triple screen” strategy
Transactions on an increase are concluded as follows:
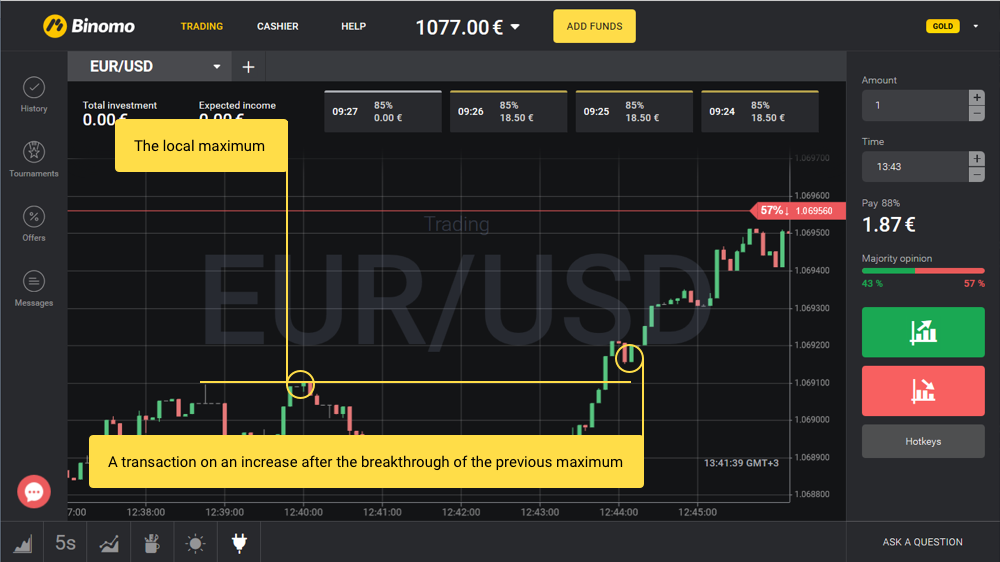
When the MACD histogram columns on the 5 min timeframe rise above the zero level, and on the 1 min timeframe the RSI line intersects level “50” upwards, we open the 5 sec timeframe and conclude a transaction on an increase provided that the quotes of the traded asset break through the previous local maximum upwards:
Transactions on a fall are concluded as follows:
When the MACD histogram columns on the 5 min timeframe fall below the zero level, and on the 1 min timeframe the RSI line intersects level “50” downwards, we open the 5 sec timeframe and conclude a transaction on a fall provided that the quotes of the traded asset break through the previous local minimum downwards:
Expiry terms and money management
As the expiry term we use a period from 1 to 3 minutes, which is enough for asset quotes to “run” the necessary distance for a profitable transaction closing.
Use no more than 3% of the amount in your trading account. This will allow you to reduce the factors of maximum drawdown and rapidly increase the profit percentage of your trading account.
Important! “Elder’s Triple Screen” is a trend strategy, for the correct operation of which trading must be carried out at the most volatile time of day, from 7:00 to 15:00 UTC.
