CFD/Forex 

Most Effective Way with Parabolic SAR

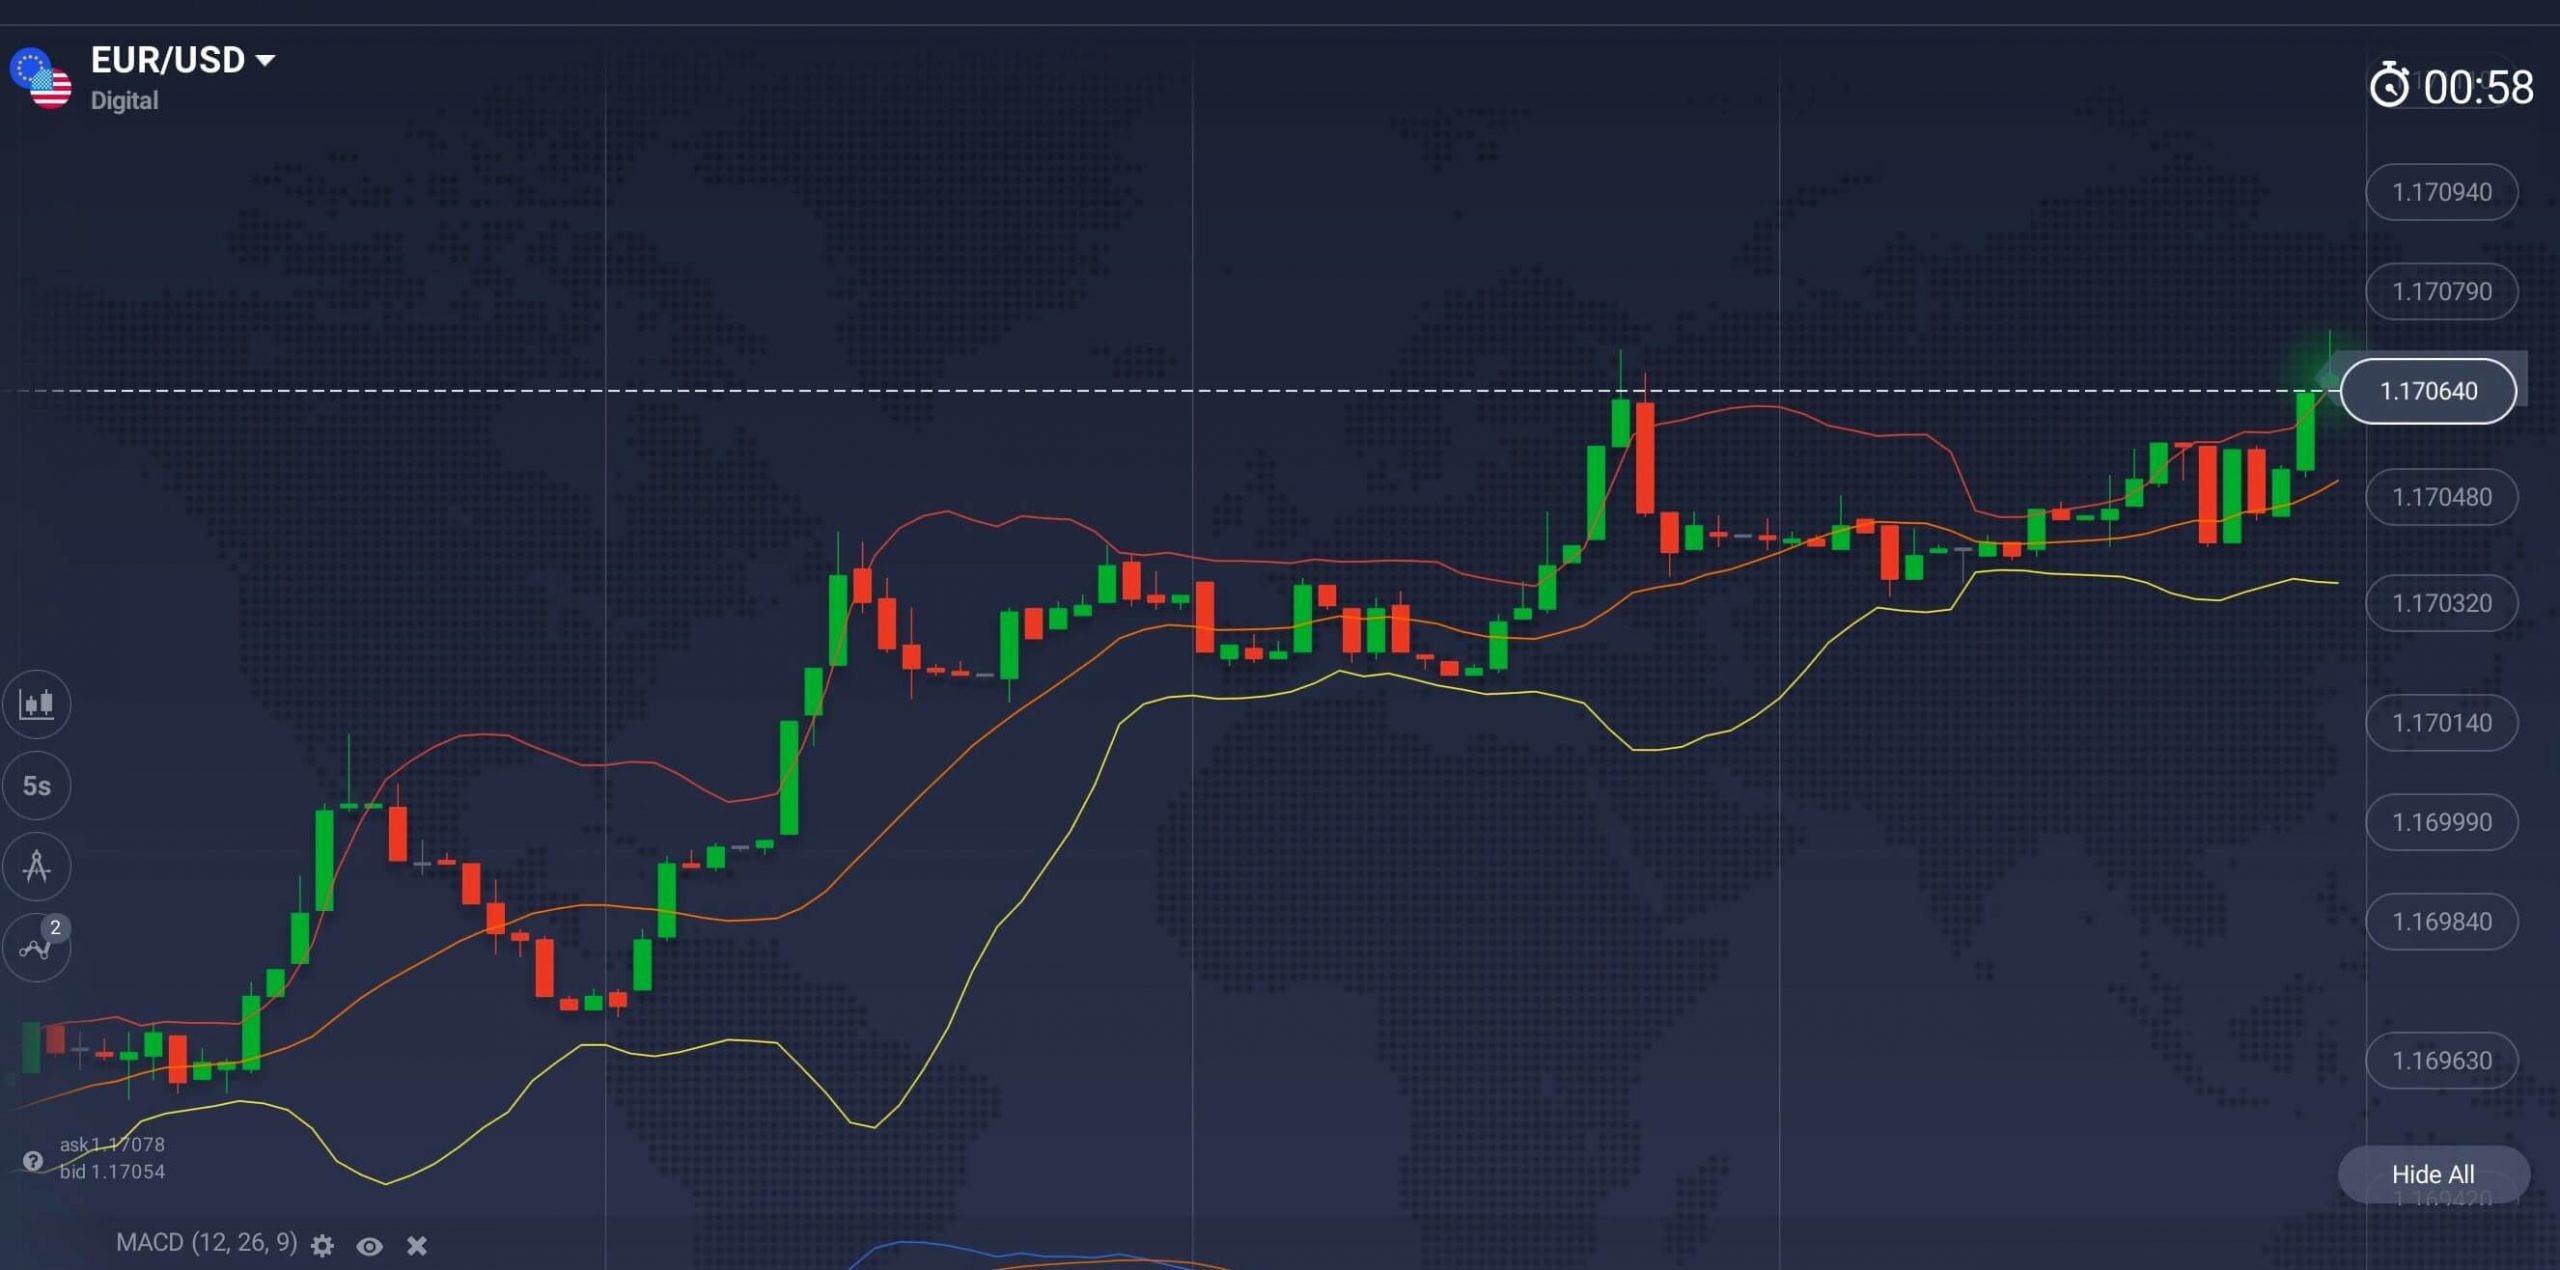
Parabolic SAR is a technical analysis indicator developed by Welles J. Wilder. It was first described in Wilder’s 1978 book, New Concepts in Technical Trading Systems. SAR stands for “stop and reverse”, it trails the price action as the time passes. The indicator is positioned below the price when the prices are soaring, and above the price when the prices are falling. The author himself called this indicator the “Parabolic Time/Price System.” The indicator was developed with the purpose of notifying the trader about possible trend changes. Being a unique indicator with…

Read More
Binary Options indicators 

Trading with Vortex Indicator

The Vortex Indicator is an oscillator that is used to determine the beginning of a new trend and to confirm an ongoing trend, its direction and strength. The indicator consists of two lines that capture positive and negative trend movements: the uptrend line (VI+) and the downtrend line (VI-). The essence of the vortex pattern lays in connecting the highest and lowest points of the market’s price bars or candles. The principle behind the indicator is quite simple — the greater the distance between the low of the current bar and the high…

Read More
Market Trends 

1 November Free Trading Signals

Our 1 November Free Trading Signals for BRN/USD, BTC/USD and ETH/USD include technical outlook as the following: 1 November free oil trading signal – BRNUSD For today’s free oil signal I am looking for Brent oil. On H1 timeframe BRNUSD fell below 200 and 50 Moving Averages, yesterday the pair also broke @ 60.00 psychological support level. I’m expecting further bearish pressure for the Brent Crude oil. Scroll down to see the signal details with my SL, TP and entry levels. 1 November BTCUSD trading signal From the technical point…

Read More
Trading 

Trading Tactics: the Pattern

What is the Wedge Pattern? One of the pillars of technical analysis theory is the idea that market mentality is mob-like, that price movements will often repeat itself and that those movements are identifiable and predictable. One such is the Wedge Pattern. The Wedge Pattern forms in a trending market and often signals continuation and not just any continuation, but a long-term continuation that will lead to payouts. What is a Wedge Pattern? A Wedge Pattern is a form of triangle that forms within a trend, like a flag or pennant pattern…

Read More
Trading 

What Makes a Great Trader?

Becoming a trader is easy. Open an account with a broker of your choice, and dive right into the exciting world of financial markets. Becoming a good trader, capable of making stable gains and relying on trading as his primary source of income, however, is much harder. What is the difference between the two and what qualities do you need to develop in order to call yourself a great trader? Jack Schwager, the author of “The Market Wizards” book series, seems to know a lot about successful traders, their career paths…

Read More
CFD/Forex 

How to Trade CFD Stocks?

CFDs are a good way of trading shares without turning to shares themselves. Stock trading usually involves hassle that can be easily avoided when trading options. Stock brokers do not offer a wide range of investment instruments. On the contrary, when trading with IQ Option, you can trade equity, currency pairs and cryptocurrencies — all in one place. The latter makes trading less time-consuming and, therefore, more effective and comfortable. How to Trade CFD Stocks This is how to trade CFDs on stocks on the IQ Option platform: Click the…

Read More
Binary Options indicators 

Three Indicators That Go Together Better Than You Might Think

For your convenience, the IQ Option trading platform is gradually expanding the range of technical indicators. These days, not a single binary options platform works without technical indicators. In fact, a significant part of these tools can be divided into two groups: trend indicators and oscillators. For the best combination, indicators from different groups are often used. Yes, it’s that simple. There are also a few exceptions. Among them are the Ichimoku Cloud, which can be classified as both of these groups, as well as the ATR and Bollinger Bands,…

Read More
Video 

Options Trading — Basic and Advanced Video Tutorials

Who needs text tutorials when all (or at least most of them) are available as videos? Not all of you know that there is a special section on the IQ Option platform dedicated specifically to video tutorials. Here you will find all sorts of videos: dedicated to instruments, indicators, strategies and important patterns you, as a trader, have to know. Here is how to find the tutorials using a web-based or a standalone application: First, push the ‘More’ button, found in the bottom left corner of the trade room. Then…

Read More
Trading 

Trading with Relative Strength Index (RSI)

The relative strength index or the RSI is a momentum oscillator used to measure the velocity and magnitude of directional price movements.  The indicator provides will help you determine overbought/oversold levels, as well as provide buy and sell signals. The RSI indicator with standard settings The RSI is basically a single line that fluctuates in the corridor between 0 and 100. The closer this line gets to the zero mark the higher are the chances for the asset to be oversold. When the RSI gets close to 100, the asset is likely to be…

Read More
Market Trends 

Market Analysis

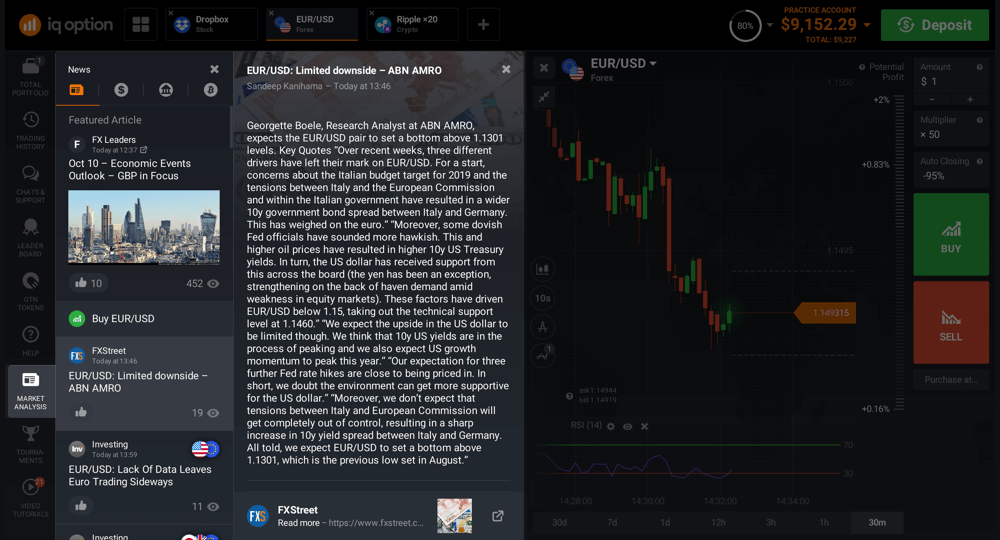
Let’s take a closer look at an often-overlooked feature called ‘Market Analysis’. It can be accessed in the bottom left corner of the trade room (it can also hide behind the ‘More’ button). This is something most traders will find useful. Why? Because it is basically 4 features in 1: smart newsfeed, Forex calendar, earnings calendar and crypto calendar. No matter what you trade, you will find relevant information that can later be used in trading there. Market Analysis feature and where to find it Smart newsfeed Thanks to this…

Read More
Trading 

Way to Increase the Probability of Winning

However, there are two tools that I still use, because in some circumstances they are very helpful. Before we decide to open an order, we seek additional confirmation that our analysis of the situation is correct. When the conclusions resulting from the observation of the price behavior additionally are supported by correct interpretation of what the indicator shows us – we have in some sense a confluence allowing us to make successful trading decision. The indicators with which I did not part with and they accompany me on a daily…

Read More
Binary Options indicators 

The Momentum indicator

The Momentum is a technical analysis tool, designed with the sole purpose of identifying the trend strength, which in turn is the velocity of price changes. The Momentum is displayed as a single line and is easy to follow. The indicator is easy to get in and will suit everyone — from novice traders to hardened investors. Read the full article to learn more about the indicators and the ways to use it. How it works? This indicator will compare the current price to the price several periods ago. The bigger the…

Read More