Candlestick Trading
Japanese candlesticks are the best way for traders to view the market, improve your results with these winning tips.
Four Tips For Candlestick Traders
Japanese candlesticks are by far my preferred method for trading the financial markets. It doesn’t matter the asset, the candles bring the chart to life in a way that make the battle between bulls and bears exciting to watch. While the candles can give a clearer view of the market and provide high-probability signals they are not easy to read. A bearish looking candle could appear at any point in a bull market, know what to do about is the key to your success.
Know Your Candles
The first step on the road to success is to know your candles. I don’t just mean know a down candle from an up candle, or a doji from a spinning top, but know everything you can about the candles formed by the market you are trading. Every market is different and every chart is different so that means the candles are different.
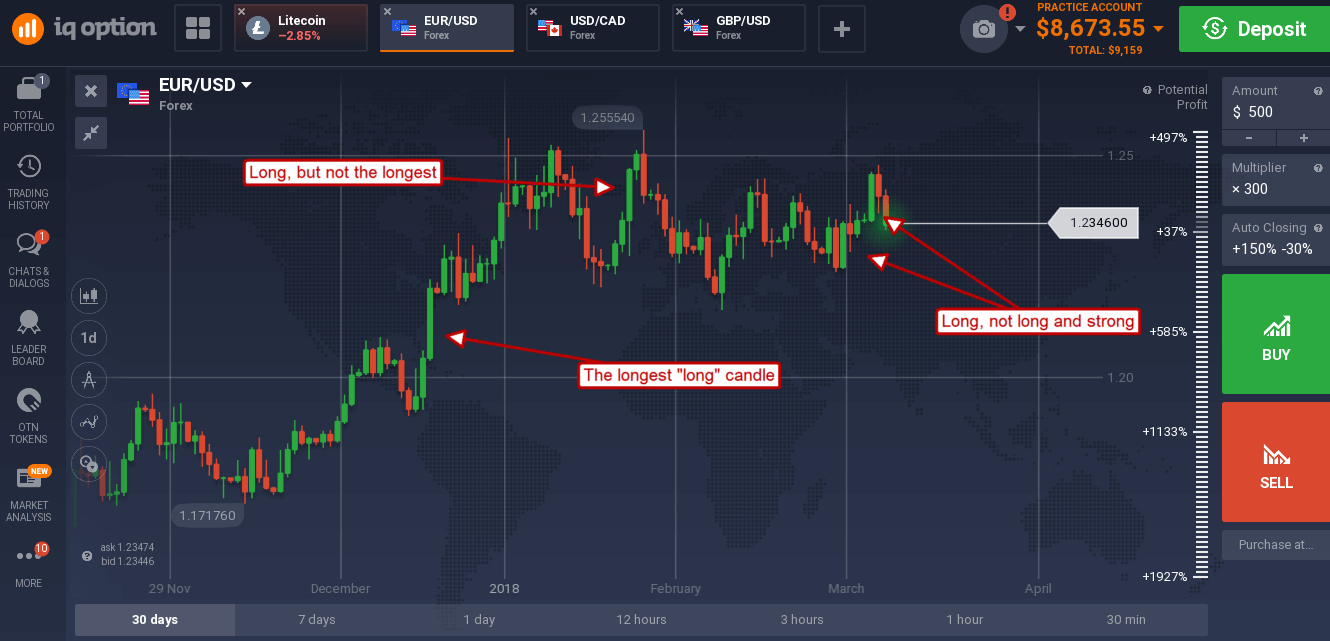
A long candle in one market may only be average in another while a doji in one may be incredibly significant on chart and commonplace on another. If you are trading the EUR/USD or the SPY you should know the difference when a long candle is just average and when it is long, strong and significant. An average candle is formed on an average day, the strong candles are formed on the high volume, high volatility days that mark major market movements.

Know Your Signals
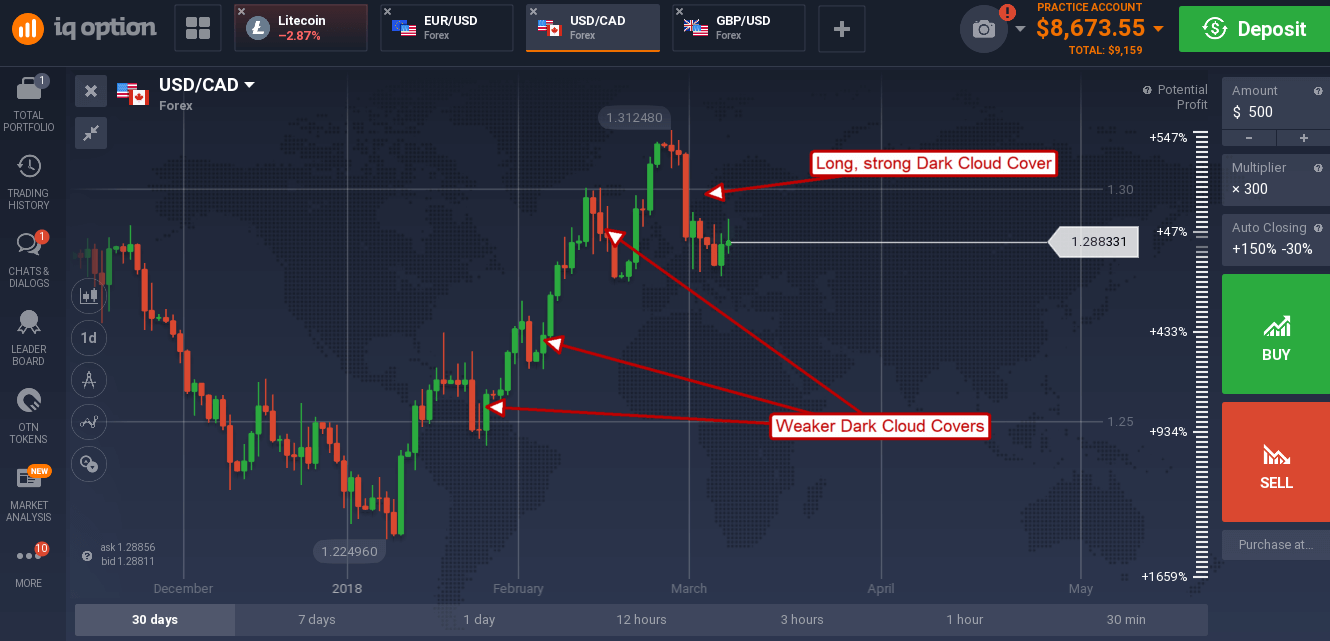
This ties in with knowing your candles. A signal is a signal is a signal until its a strong signal that you should act on. The first thing you need to know is what makes a good signal, and then understand that the signal is only reliable when the candles are larger than normal, have longer shadows than normal or a combination of both. If you look at the chart below I’ve pointed out a couple of technically accurate candle signals that turned out to mean nothing because they were formed by average, day to day trading action.

Relativity Is Everything
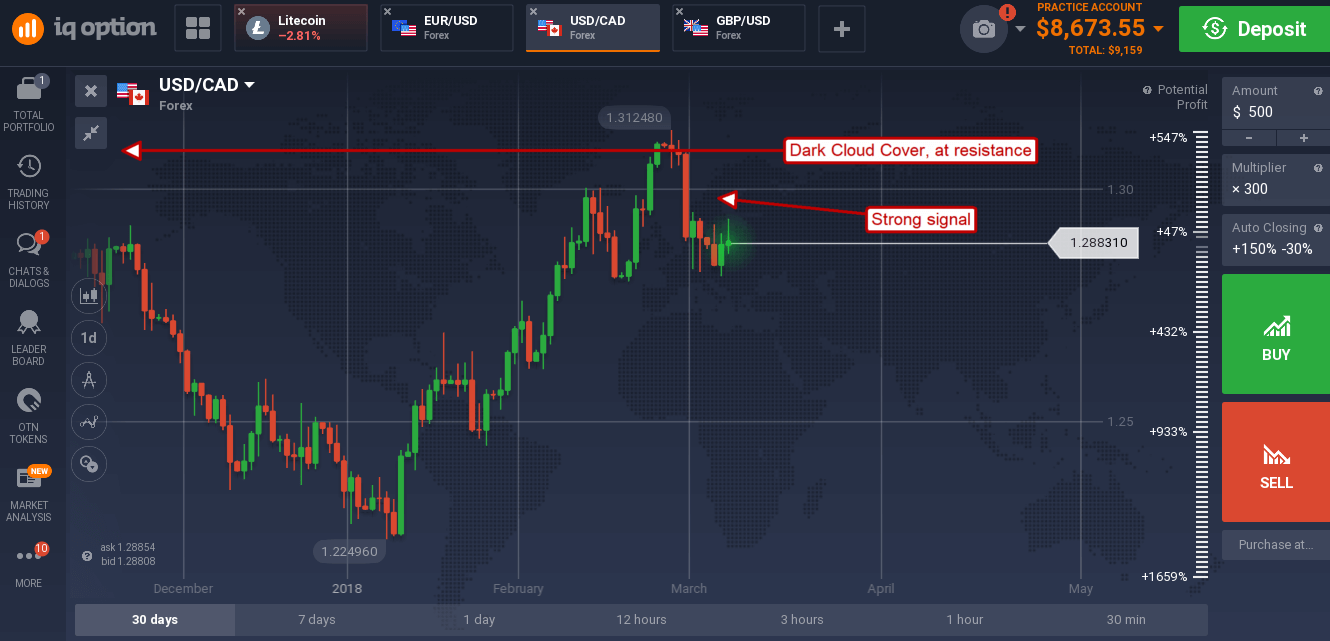
A candle signal may form at any price level on a chart. A really strong candle signal will usually form at or near a key support or resistance target. Support or resistance targets are price levels where buyers or sellers should be expected to enter the market, a session of high volume or high volatility at one of these levels means a lot people agree with that analysis. The question is, what signal is formed? Is it a bullish signal, a bearish signal, a continuation signal or a reversal signal? A bullish candle breaking above resistance is a sign of bullishness but may not lead to continuation if it forms in a downtrend. Remember, relativity is everything.

Wait For The Close
One of the most important things about trading candles is waiting for the candle to close. Remember, it’s not a signal until the candle closes, long-legged shooting star dojis start out as long, strong bull candles but they don’t end up as one. Waiting for the close sometimes means waiting for the next day’s close as well. When prices are trading at or near resistance/support a long, strong candle may form and it may look like a continuation is going to happen but if, the next candle, a small candle forms within the body of the first (Harami) a reversal becomes more likely.


