Binary Options indicators 

EMA Trading Techniques

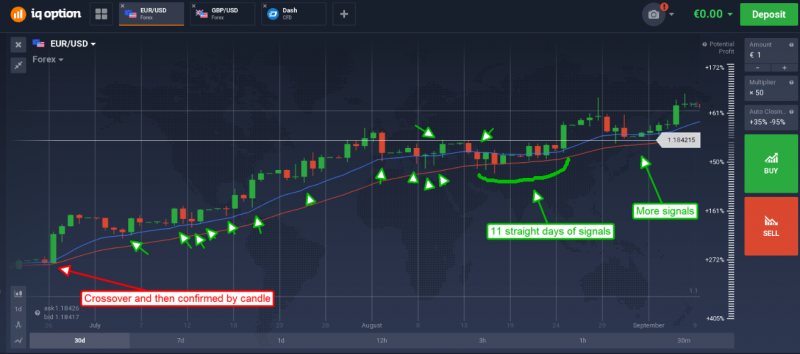
A moving average is a powerful technical analysis tool, and even more powerful when it is an exponential moving average. When used together, these two lines form an indicator that is beyond belief. If you still don’t use it you probably should. Getting strong signals with a simple tool   Moving averages are good at what they are doing. They plot average prices of an asset for given period of time on a chart. Moving averages can follow the trend, act as support and resistance lines, detect reversal points and…

Read More
Binary Options indicators 

Parabolic SAR : Stop and Reverse

Parabolic Stop and Reverse is a tool for active traders, intended for use by futures traders with a need to always have a position open. PSAR, parabolic stop and reverse, is one of the more esoteric indicators. It was originally intended for use in the futures market but like most good trading tools it is applicable to any form of trading with a chart of prices. The original use was for hedging positions. Some futures trading, those whose job it is to buy and sell physical commodities not just speculators,…

Read More
Binary Options indicators Binary Options strategy 

The wedge has a very strong signal.

Remember how we told you about trading in triangles? Now we’ll talk about one of the varieties of triangles – the wedge shape. The main feature and advantage of the wedge is that it is formed faster than a regular triangle, which means you won’t have to wait as long! The wedge is a strong reversal pattern if it is in the direction of the trend. And if the wedge is in the opposite direction of the trend, this indicates a continuation of the trend, at least for the near…

Read More
Binary Options indicators 

Five best indicators for binary options trading

All binary options indicators are categorized into the following types. It is therefore important to understand the types of indicators rather than focus on tons of endless indicators that promise to make you rich. Moving Average: The Moving Average indicator is probably one of the best trend based indicator that is available. It is flexible as it allows traders a lot of modifications such as setting the period to Close or Open, High or Low as well as changing the period and not to forget the different moving averages such…

Read More
Binary Options indicators 

Fibonacci Lines in Trading

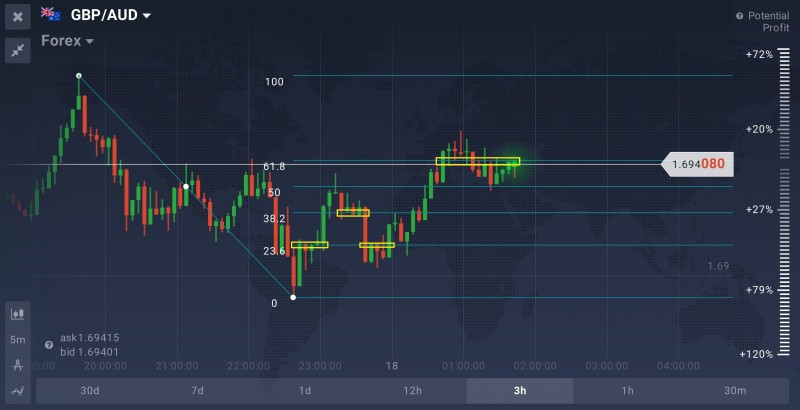
Fibonacci Lines are a powerful technical analysis tool that can be applied to both downward and upward trends, all assets and timeframes. The tool is represented on a price chart as a collection of horizontal lines that correspond to Fibonacci ratios of 23.6%, 38.2%, 50%, 61.8% and 100%. It is used to determine the most probable support and resistance levels. The tool is named after a 13th-century Italian mathematician Fibonacci and his self-named mathematical sequence. How to Use Fibonacci Lines in Trading? To use the tool effectively we first have…

Read More
Binary Options indicators 

Andrews’ Pitchfork indicator

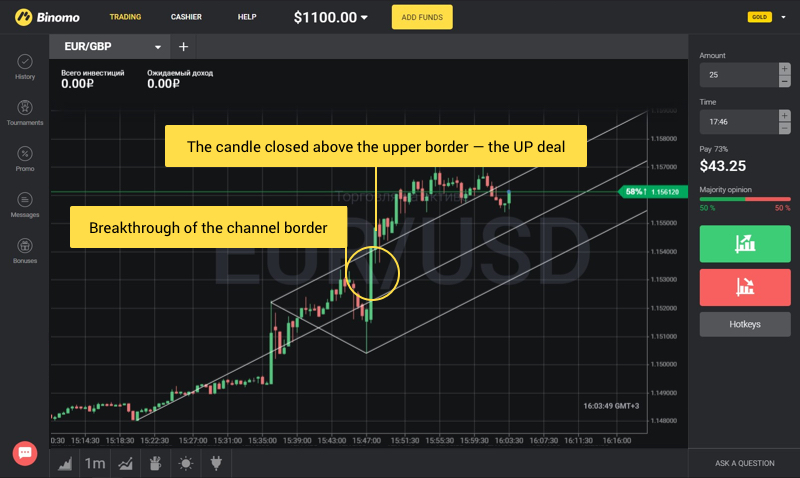
Alan Andrews is the famous trader who developed the Andrews’ Pitchfork indicator. He never disclosed the secret of his success until he retired from trading. A secret worth keeping must have been bringing a serious profit! In this article, we will show you how to install and apply Andrews’ Pitchfork for trading on Binomo. Setting up a template Look at the quotations chart. If the quotes graph is rising, we will be looking out for moments to make transactions UP: select “Pitchfork” in the Tools tab; detect the moment when…

Read More
Binary Options indicators 

The Average Directional Index (ADX)

The Average Directional Index (ADX) is a technical analysis tool used to measure the trend strength. The plus directional indicator (+DI) and the minus directional indicator (-DI) accompany the ADX line, highlighting the direction of the trend. Used together they form a trading system that is able to determine both the direction and strength of the trend. The ADX is used to identify strong trends and potentially profitable entry and exit points. This indicator was developed and introduced to the public by Welles Wilder, a twentieth-century technical analysis guru. ADX…

Read More
Binary Options indicators 

Average True Range

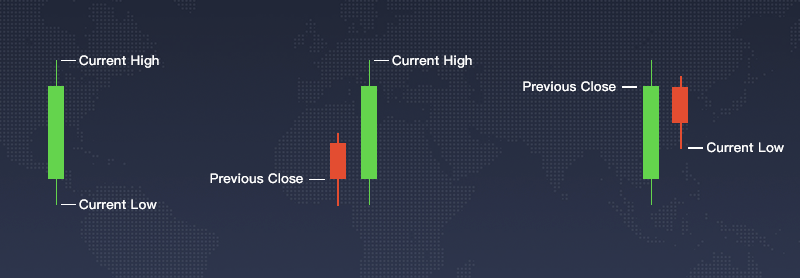
Average True Range is a technical analysis indicator that works as a measure of volatility. It was introduced — along with many other technical analysis tools — by Welles Wilder in his book, “New Concepts in Technical Trading Systems.” As of now, ATR is one of the most commonly used technical analysis indicators that withstood the test of time and made its way into many trading platforms. The ATR indicator as displayed in the IQ Option trading platform How does it work? Though it may not seem like it the…

Read More
Binary Options indicators 

The Stochastic Oscillator

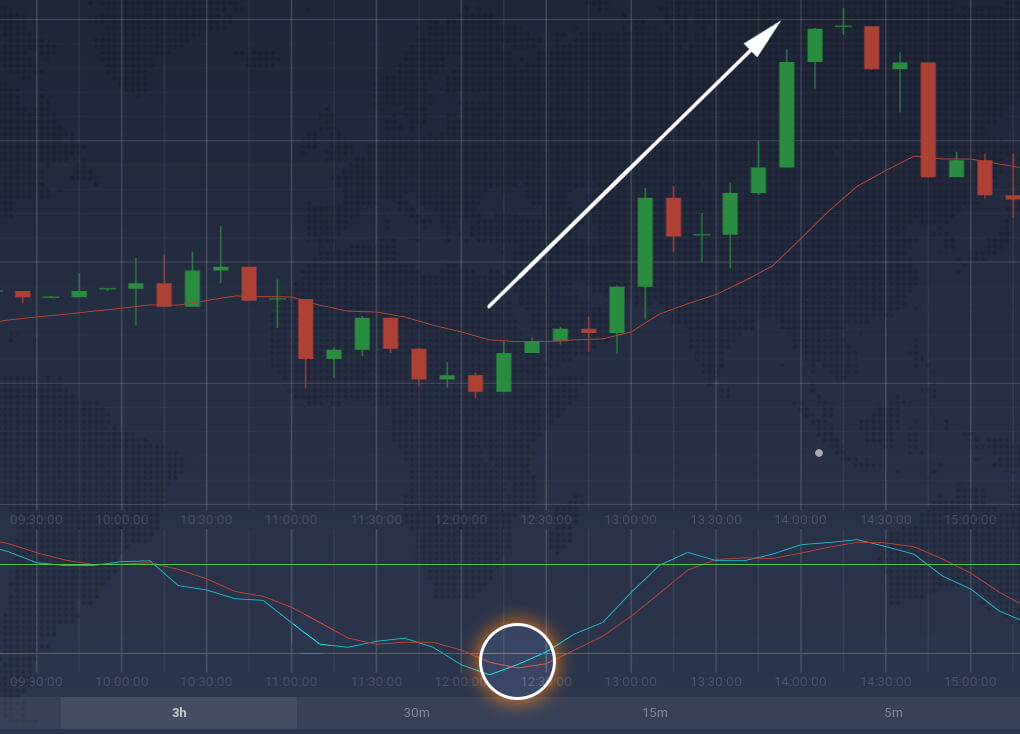
The Stochastic Oscillator is a momentum-type indicator that determines overbought and oversold positions. In other words, it can provide the one with information on when to enter or leave the market. The indicator is also used to predict future performance of the underlying asset. It was created and introduced by George C. Lane in the 1950s. The Stochastic Oscillator as demonstrated in the IQ Option trading platform How does it work? According to Lane himself, the indicator “doesn’t follow price, it doesn’t follow volume or anything like that. It follows…

Read More
Binary Options indicators 

The Awesome Oscillator (AO)

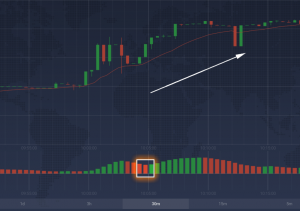
The Awesome Oscillator (AO) is a histogram-type indicator designed to measure market momentum. It was first introduced by Bill Williams. The intent of this indicator is to show what is happening to the momentum of a currency pair in recent trading within the context of a wider time frame. The indicator is used to confirm the trends and determine possible reversal points. The Awesome Oscillator indicator demonstrated under the price line How does it work? The idea behind the Awesome Oscillator is simple. Basically, the indicator is a moving average…

Read More
Binary Options indicators 

What is the MACD indicator?

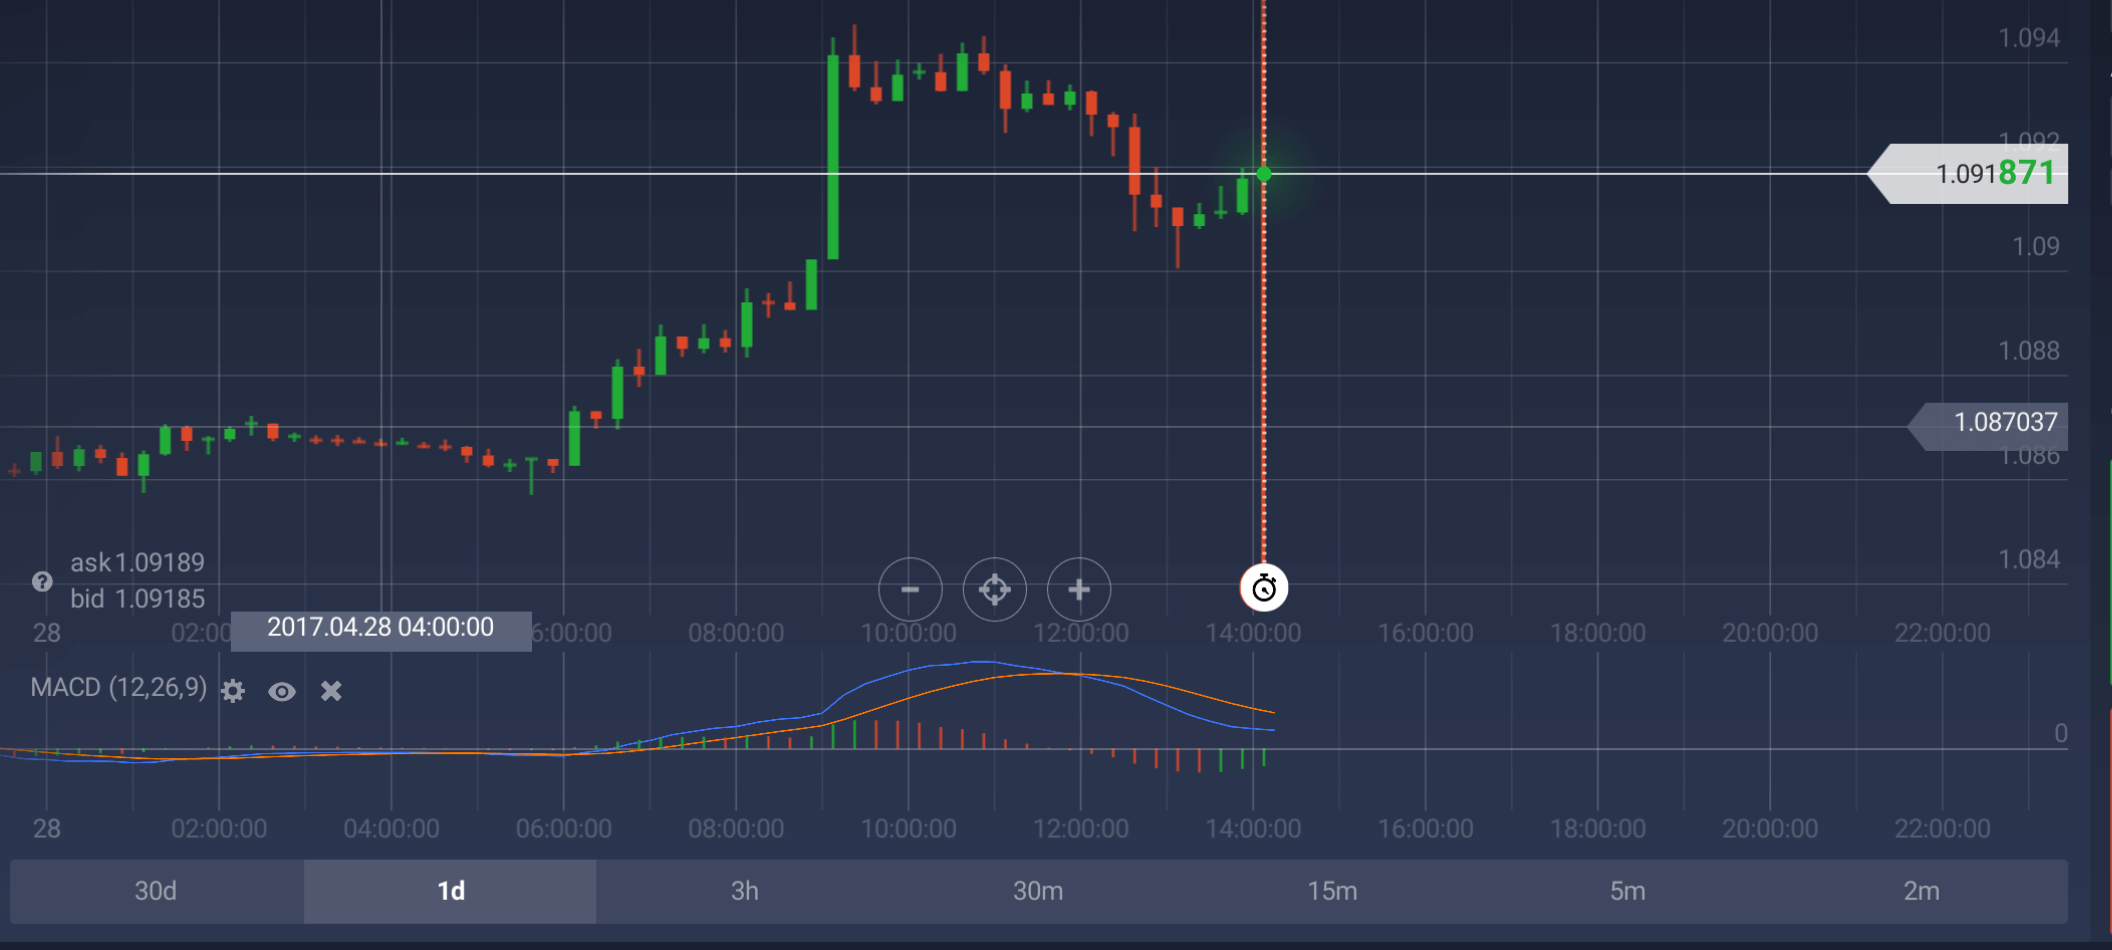
Moving average convergence/divergence or the MACD is one of the simplest and most effective momentum oscillators ever created. The MACD is a trend-following momentum indicator. The indicator was developed by Gerald Appel in the late 1970s. How does MACD work? This indicator is well suited to identify entry and exit points. The MACD provides corresponding signals in the beginning and in the end of the trend. Fast and slow lines It may seem like understanding the principles behind the MACD is harder than putting the indicator into practice. To better…

Read More
Binary Options indicators 

How to use Bollinger Bands in trading?

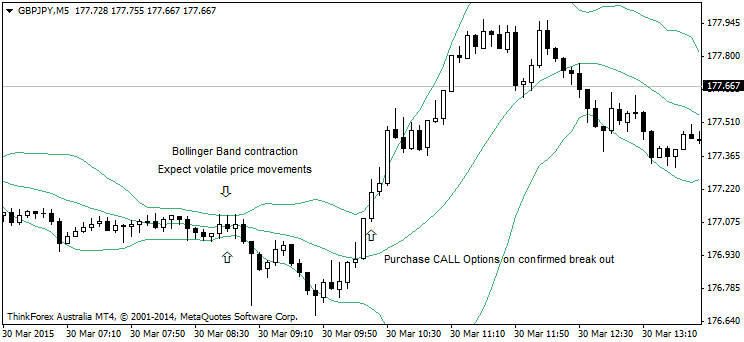
Bollinger Bands are a technical analysis indicator, that was first introduced in the 1980`s by long-time technician John Bollinger. Indicator’s main purpose is to predict the future behavior of the price chart. Bollinger Bands consist of a moving average and two trading bands. The latter are the result of adding (subtracting) a standard deviation to (from) a normal moving average. In statistics, the standard deviation is a measure that is used to qualify the amount of variation. In technical analysis, the standard deviation (SD) is used to estimate price volatility…

Read More