CCI + MA Trend- for Binary Options Trading
Your capital may be at risk. This material is not an investment advice.
A basic definition of a trend is a quotation’s general position relative to its average values. That’s why the MA indicator is absolutely indispensable in determining the current trend. Unfortunately, the moving average does not show traders what point is ideal to enter the deal towards the trend direction. For this purpose many traders use the CCI oscillator.
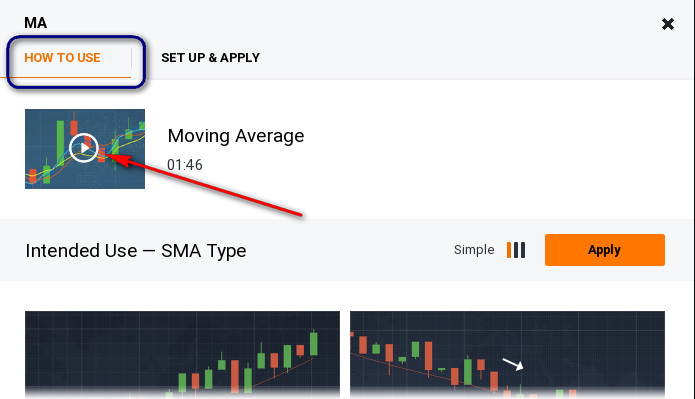
A brief outline of types of moving averages and their applications is included in the explanatory video about the indicator, located in the MA settings window of the IQ Option platform.
In addition to the video, we inform you about common strategies, using different types of moving averages with other indicators involved, with clear and brief explanations from basic to advanced levels.
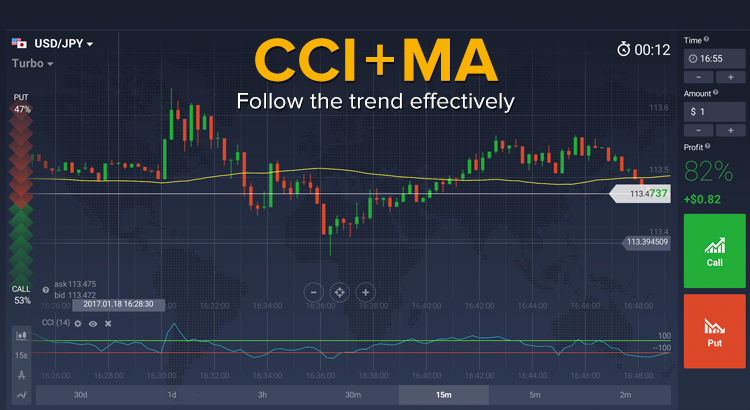
The idea is simple – to determine a trend using the moving average, enter on a basis of crossing the +100 level of the CCI indicator curve.
Indicator settings
The three following questions arise when setting up any trading system:
- Work timeframe;
- Indicator settings (indicator period, curve type to be used in the strategy);
- Time to hold the position (option expiration);
A large number of issues arise regarding the choice of the moving average type. It is considered that the basic moving average gives a lot of false signals on flat sections, and other types diverge in the presence of weight coefficients, giving the latest data greater importance. The overall winner is the exponential moving average, where influence with the nearest average values grows exponentially.
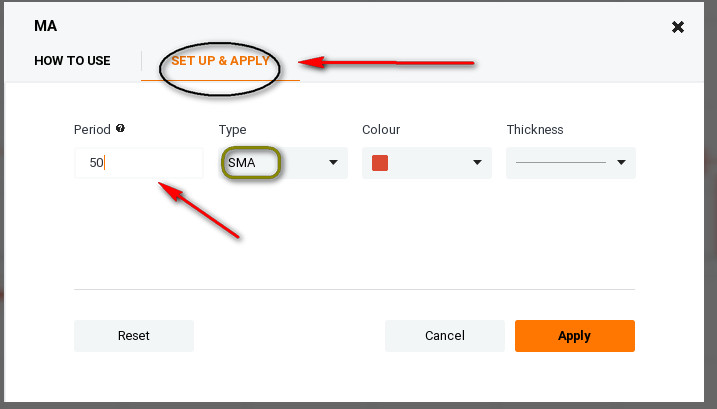
Natural selection has decisively resolved any disputes on the usage of moving average investor periods of 50, 100 and 200. They are used by analysts in reports and to this day they are set in the trading platforms of portfolio managers. Let’s make a simple moving average with a period of 50 within the IQ Option trading platform:
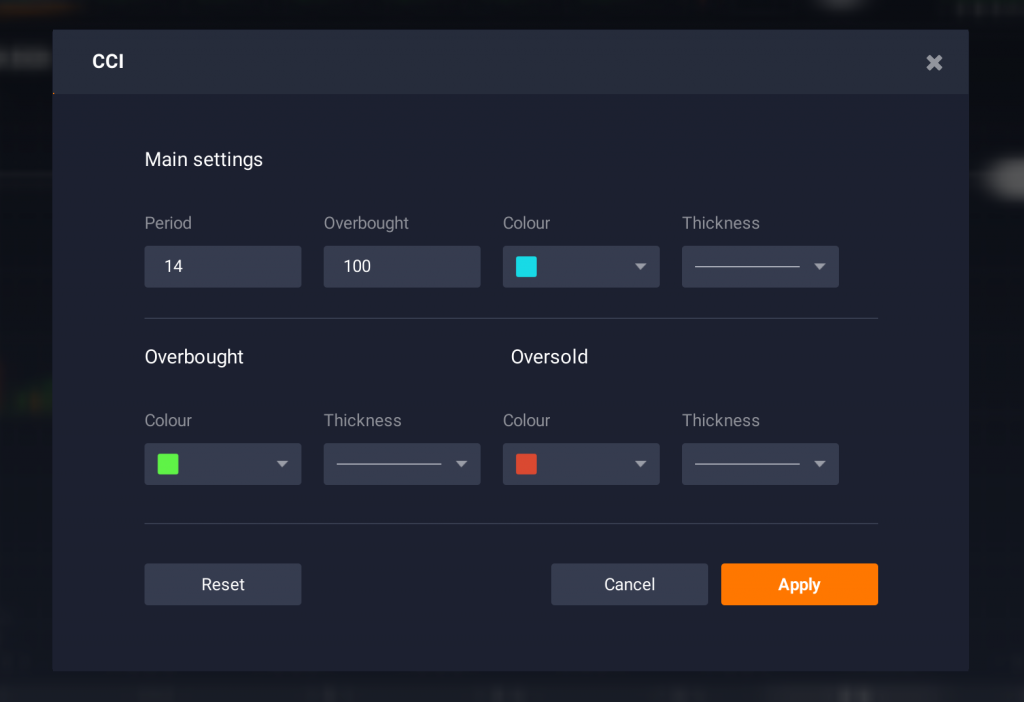
Indicator settings are directed to identifying a trend – CCI with period 14 and SMA with period 50:
Upward trend
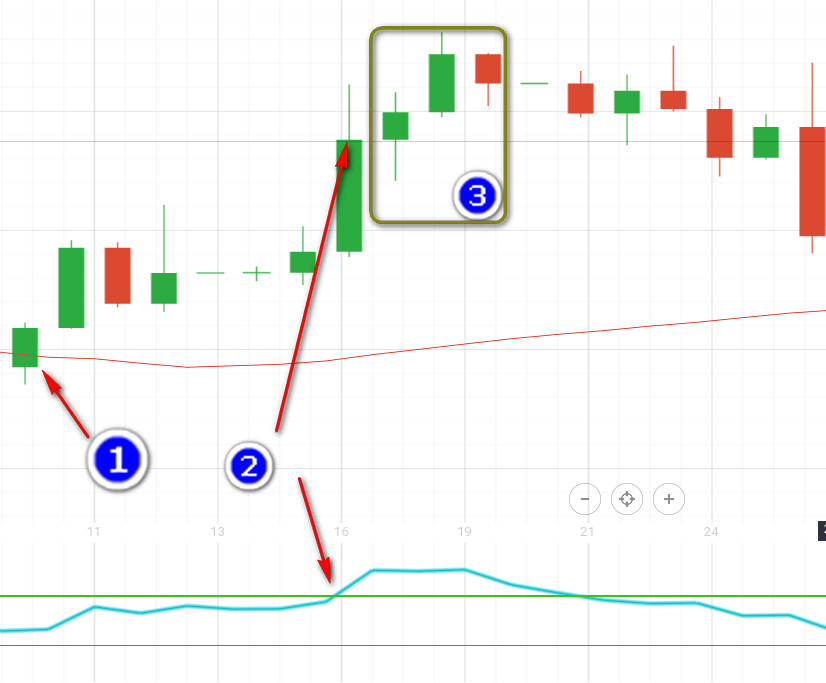
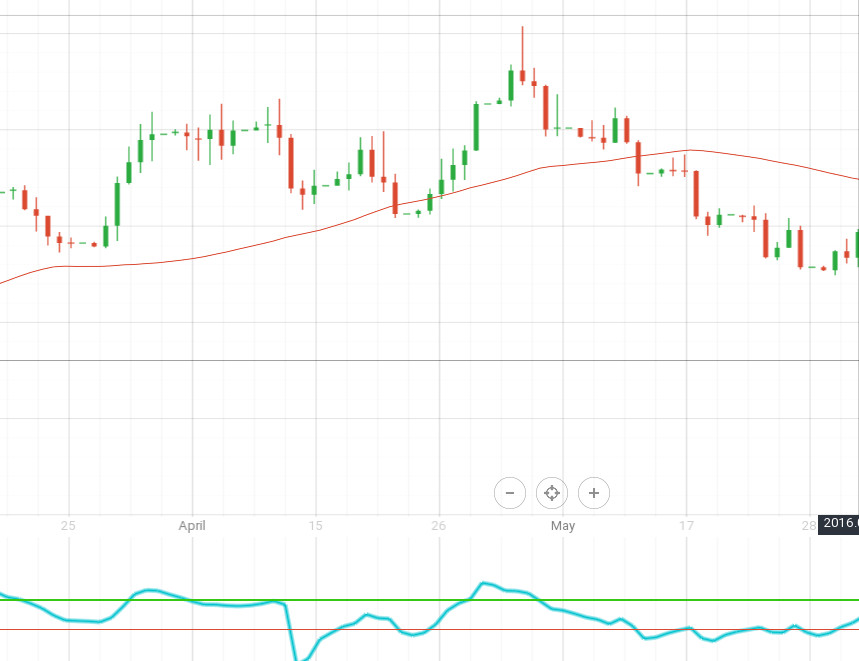
The signal of an upward trend’s inception is given by a candlestick crossed and closed above the SMA line. CCI readings should be more than 100. The figure below shows the features of upward trend inception: price crossing the moving average and quotations closing above the line (1).
Just keep waiting until the CCI indicator shows a value of 100 or above (2). With this method traders prefer to buy options 3-4 candles ahead.
Downtrend
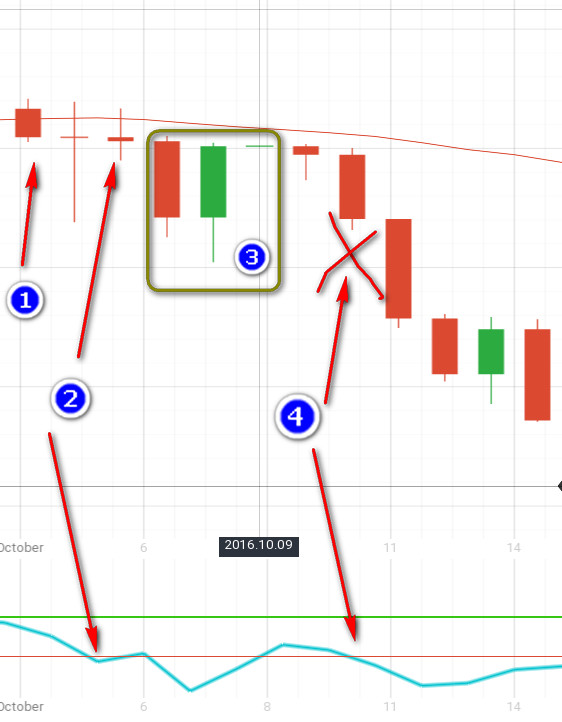
In case we are preparing to buy a Put option, it is reasonable to wait for the congruence of quotations crossing the SMA line top-down, with the price of closing the candlestick below this line and CCI decreasing with readings below 100, as shown in the figure below. The intersection of quotations with SMA took place earlier on, so we do not enter.
Wait for CCI to fulfill the proper condition, see it in point 2, and hold for three timeframes (3).
The task of subsequent purchases of binary and turbo options on this trend is performed as follows. One intersection equals one trend; thus, despite the fact that point 4 of the situation in the figure above depicts the issue of finding quotes below SMA and newly appeared CCI signal below 100, which beforehand rose above that level, we do not enter this position here.
Indicator periods
Is it possible to scale this trading method on various timeframes? The classic method involves the application of CCI + MA methods on daily candlesticks. Considering the smaller timeframes, we change the period of the moving average: for 4-hour candlesticks it will be 100, for 1-hour and below – 200, the CCI indicator stays at the same 14 period. If you want to experiment, don’t look for values of this period above 24.
Novice traders try to find the ideal values for indicators and systems via brute force or by searching in literature. They are not alone in that matter, as investment institutions give similar tasks to mathematicians, the designers of new indicators. The grail has not yet been found. There exists already a good understanding of the existence of cyclical changes in the market, but their parameters are constantly changing. To reflect these changes precisely still seems to be impossible, as it is thereby to connect their functional dependency to something and thus make a clear prediction. For the best possible analysis, use the period values from the books of trading classicists, as they usually work consistently with the market cycles.
