Fractal Chaos Bands Indicator
It may seem that the market moves in a chaotic way, however, once the insignificant price fluctuations are filtered out, a certain pattern may be traced.
The bands of the indicator basically resemble the movement of the chart, but they smooth out the price noise, only taking significant price movements into consideration.
How to use it?
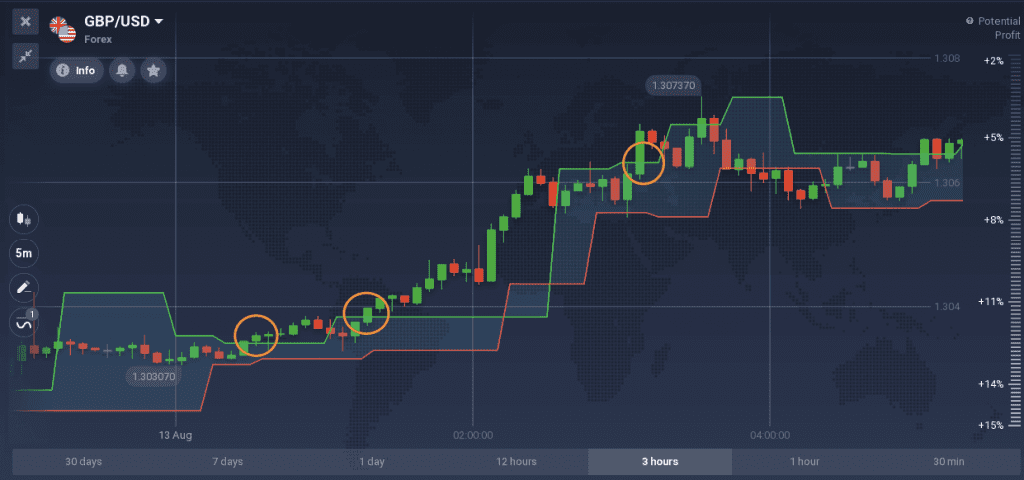
When the band is flat, it means that the asset price is more volatile. The signal to a starting trend is when the bands start moving further apart, resembling stairs.
A trader may apply the breakout strategy when using this indicator.

An example of a Buying signal received from Fractal Chaos Bands
Confirm with the Simple Moving Average
The signals of Fractal Chaos Bands may be further confirmed by using a Simple Moving Average. For such a combination, a buying or selling signal from the bands will be confirmed by the chart position regarding the moving average: crossing it from below for an upward trend or from above, when the trend is downward.
An example of a Selling signal: the chart is moving below the SMA, breaking through the lower band of the Chaos Bands indicator
How to apply the Fractal Chaos Bands?
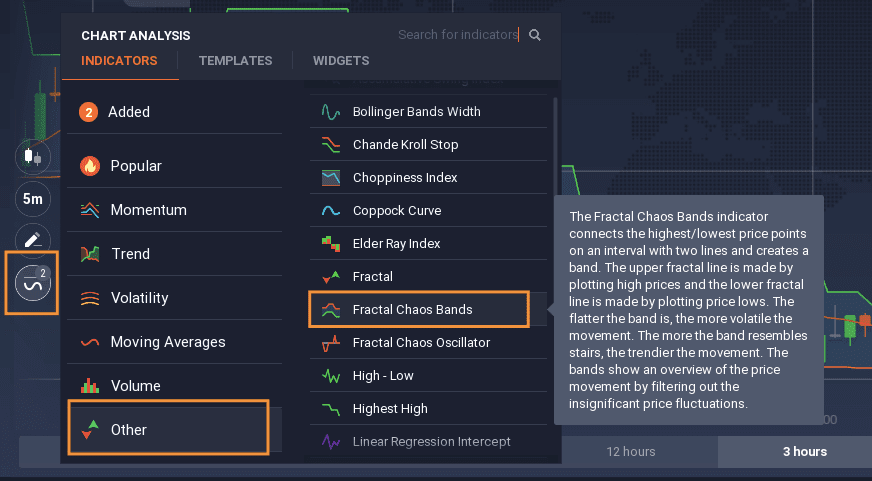
As the indicator does not require any complicated calculations, it can be applied to the chart straight from the Other section of the Indicators tab on the platform. The color of the bands may be changed for convenience.

This indicator may be combined with other trend or momentum indicators so it is truly universal in that sense. Of course, it is important to remember that no indicator can guarantee 100% success, so a risk management strategy is crucial.
Now that you know how the Fractal Chaos Bands Indicator works, you can try this indicator on your demo account and see if it could become a part of your trading approach.


