Indicator strategy «Enter on the pullback»
Your capital may be at risk. This material is not an investment advice.
If you open a trading platform and see a growing trend, don’t hurry to conclude a transaction right away! By applying several stages of technical quote evaluation, you will be able to make a trade at the best price, reducing the possibility of losses by at least 50%!
What is quote correction?
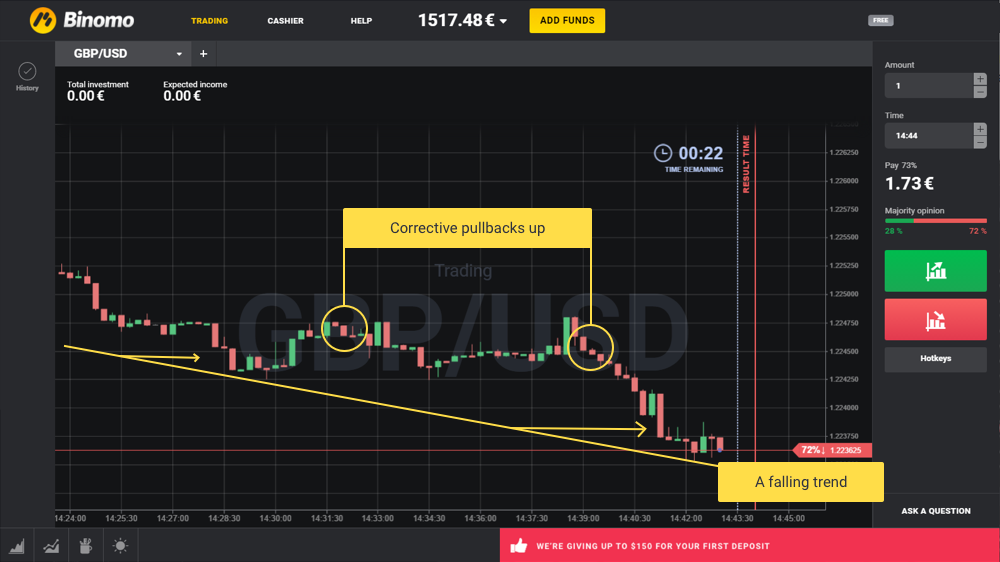
Asset quote correction is a minor price pullback in the opposite direction of the general trend movement. Such corrective pullbacks occur on the quote charts of any stock exchange asset and demonstrate short-term trader mood swings:
It’s as if asset quotes are trying to gain strength for the continuation of the main trend. Which means if you correctly identify the maximum point of pullback, you can learn how to enter into transactions at such levels where the price is unlikely to return anytime soon.
The indicator for identifying correction
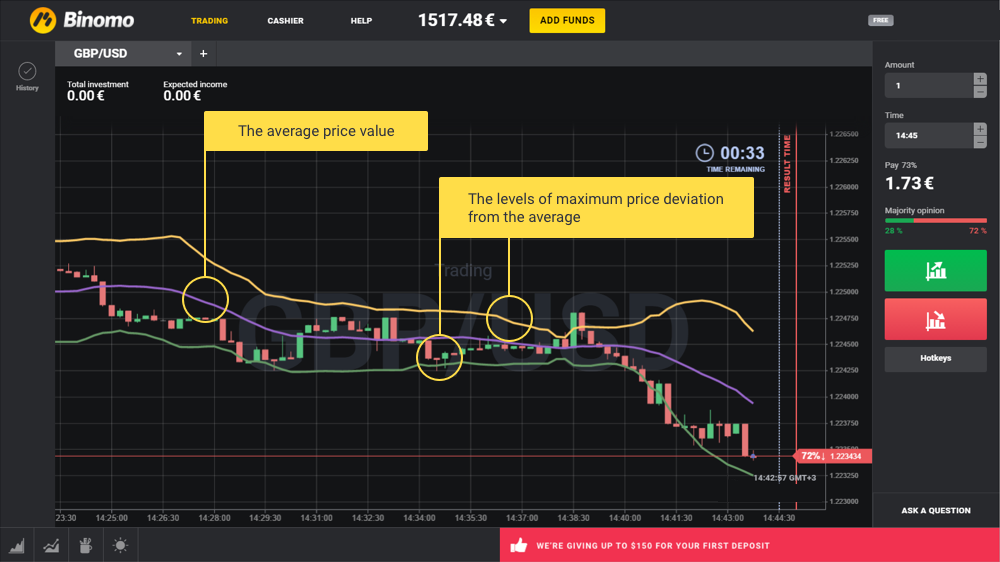
One of the most effective indicators for recognizing price adjustments are the Bollinger Bands. This technical indicator defines the average price for a certain period of time, as well as the maximum deviation from the average price. Thus, the Bollinger Bands can show the highest level of growth or decline rates, after which the correction returns back in the direction of the trend. In this strategy, the Bollinger Bands are applied with their default settings.
The indicator for the direction of the trend
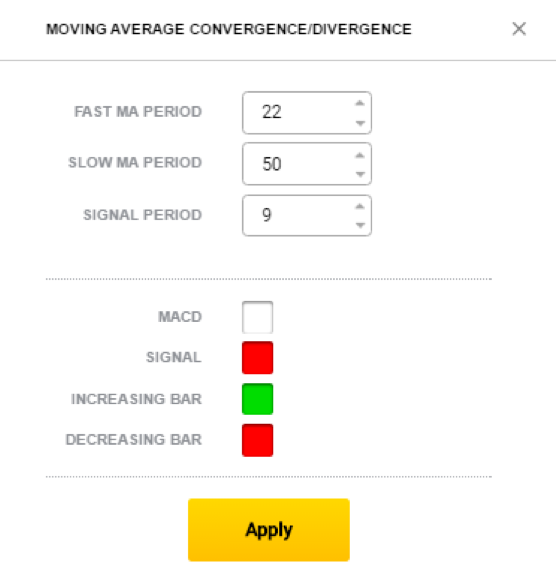
In order to identify the direction of the trend whose corrections you will trade on, we suggest using the MACD indicator. To set this indicator for use with the trading strategy on pullbacks, we change the parameters of the “fast” and “slow” averages as shown in the picture below:
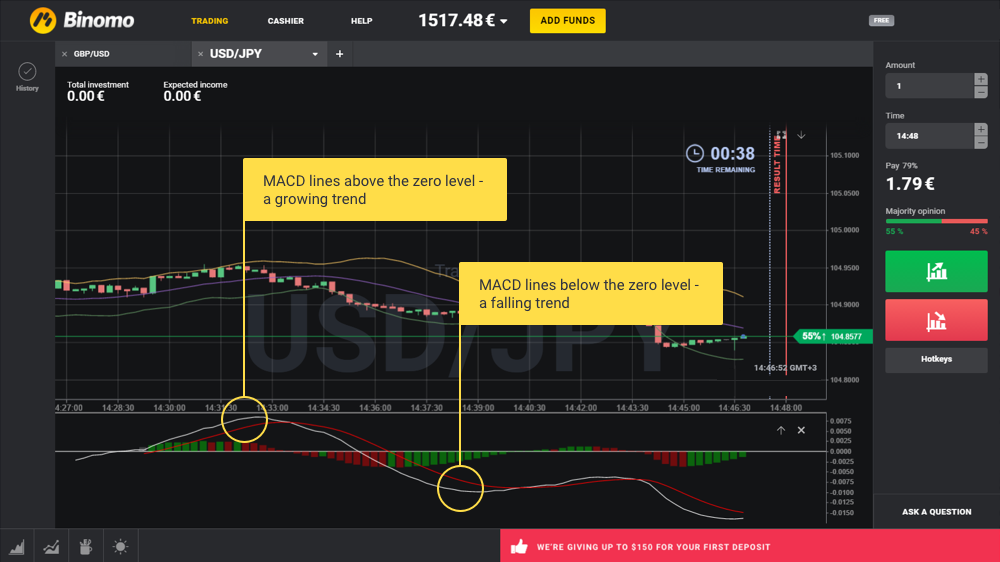
If the MACD lines are above the zero level of the indicator, it means that quotes are moving within the framework of a growing trend. If they are below, it means the trend is falling:
How to trade on corrections?
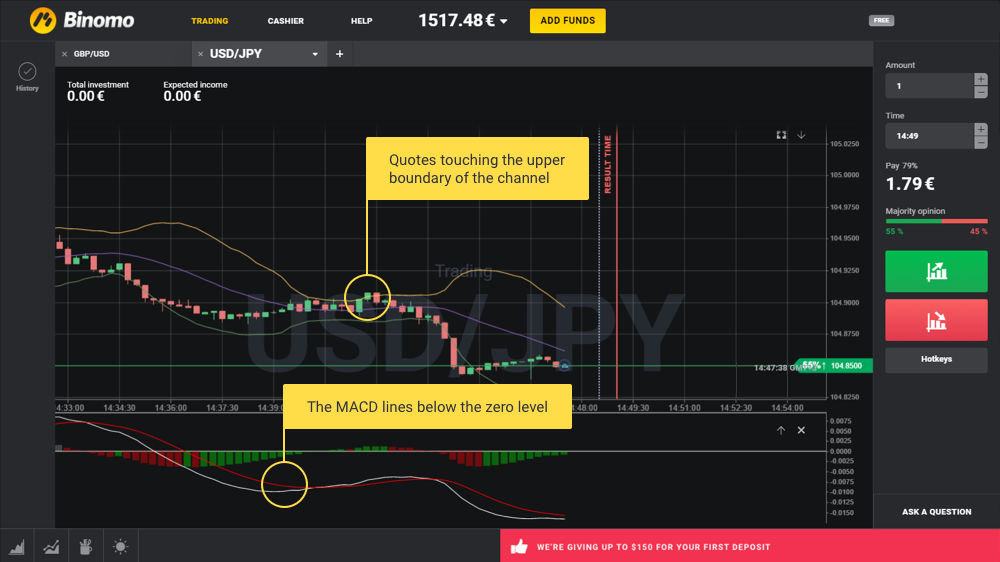
Transactions on a fall in the price are concluded under the following conditions on the chart:
- The MACD lines are below the zero level, which demonstrates a declining trend on the market of the asset.
- Trading asset quotes have touched the upper line of the Bollinger Bands, demonstrating quote correction in the opposite direction from the trend. At the same time, the price reaches the upper boundary of the indicator channel, showing that the correction has reached the maximum values. Once we have the conditions described above, we conclude a transaction on a reduction in the price of the asset:
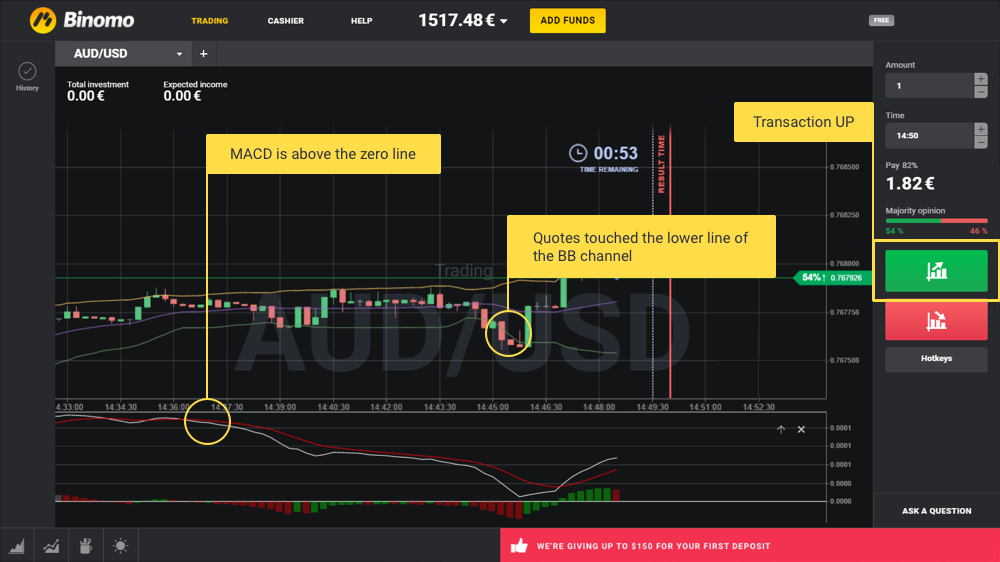
Transactions on a rise in the price are concluded under the following conditions on the chart:
- The MACD lines are above the zero level, which demonstrates a growing trend on the market of the asset.
- Trading asset quotes have touched the lower line of the Bollinger Bands, demonstrating quote correction in the opposite direction from the trend. At the same time, the price reaches the lower boundary of the indicator channel, showing that the correction has reached the maximum values. Once we have the conditions described above, we conclude a transaction on an increase in the price of the asset:
As practice shows, the use of this strategy allows the trader to increase their number of profitable trades up to 80% of their total trades. This means that trading on pullbacks is one of the best ways to increase the size of your trading account!
