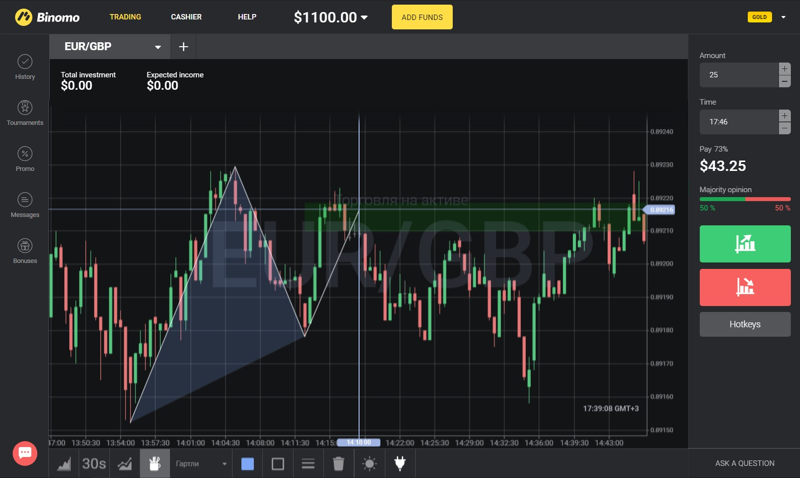
The binary options tool “Gartley”
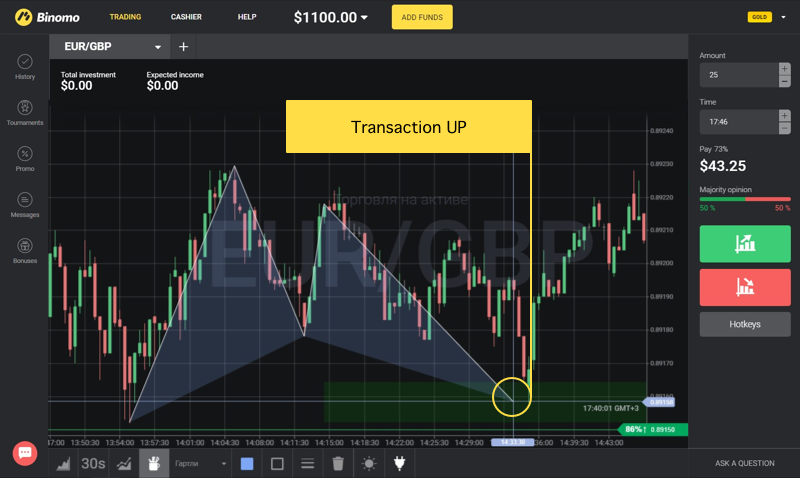
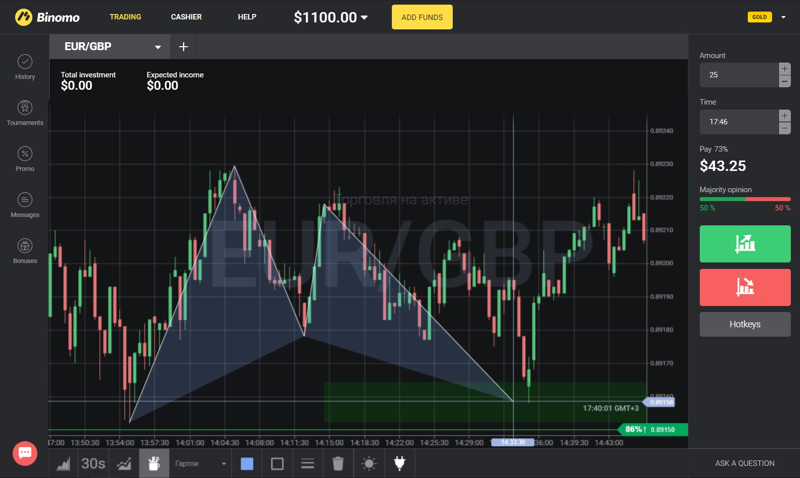
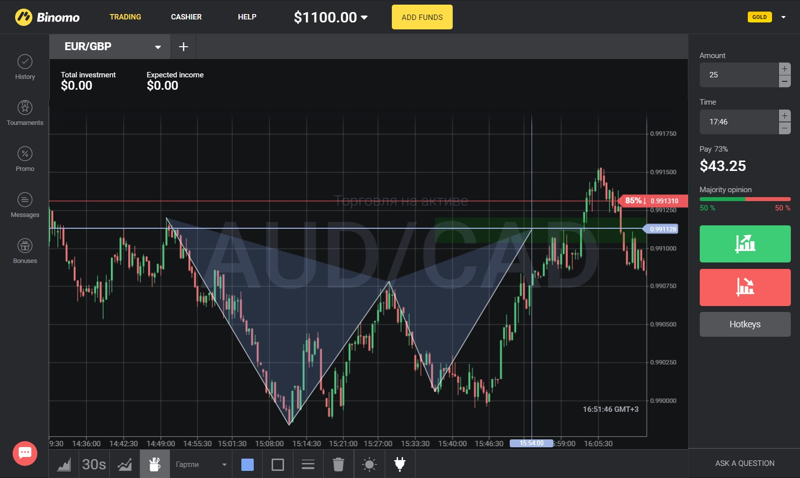
There are certain patterns of price movements which can be identified using Gartley. This tool helps to visually identify areas of reverses. It is also called the Gartley Butterfly because it looks like this:
Or like this:
It’s easy to build:
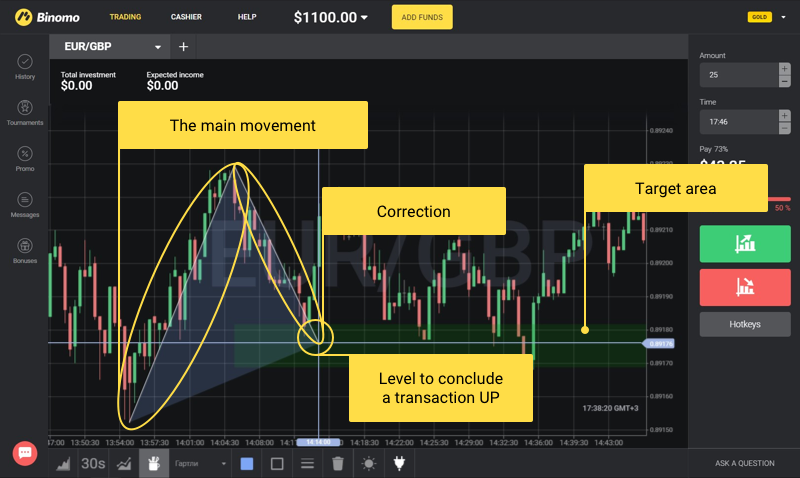
1. Choose an interval with a correction as shown in the screenshots above.
2. Mark the main movement: find the Gartley tool in the platform menu and click on it. Then click on the starting point of the main trend and pull a line along the trend till the final point of the trend. Click on it as well. The area where the correction is expected to end is then automatically highlighted.
If the correction makes a reverse in the area highlighted green, we move to the next step. If not, we wait for the next long movement with a correction to build another “butterfly”.
3. Mark the correction (the reverse movement) with a second segment. The area where the correction ends, the price a reverse and a new wave of trend movement starts is automatically highlighted.
If the reverse happened in the area highlighted green, we continue. If not, we wait for the next movement.
4. When the price enters the target area and makes a reverse, we mark the last movement by a third segment. We get the final highlighted area.
When the price enters the last target zone and starts to make a reverse, we conclude a transaction following the main (the first highlighted) movement. In this case, it’s an UPward movement.
Important! The highlighted target ranges are limited only vertically (by the price), and not limited horizontally (by time). That is, the price can enter the target range highlighted green:
- In 1 minute — at once, as one candle;
- In 5 minutes — gradually, as a number of successively growing (or falling, depending on the direction of the “butterfly”) candles;
- In several “calls” — with short corrections, consolidation.
If the first “butterly wing” is quite short (horizontally), and the second one is stretched, but all the reverses happen within the target zones, this mean the tool works. If the price did not enter the target area immediately after the reverse, it may well enter it later. It depends on the specifics of a particular trading instrument (currency, raw materials, stocks) with which you work.
Recommendations
The more “butterfly” segments you build, the more likely you will be able to complete it.
It is better to conclude transaction after you receive confirmation signals from other indicators.
It is better to enter a transaction following the direction of the first movement (trend), not the corrections, and only after a confirmed reverse and the exit of the price from the green area.

