The “Momentum + RSI” strategy
The “Momentum + RSI” strategy is suitable for trading on a flat. It is based on volatility analysis and works well on calm but not “dead” markets.
One plus of the strategy is that it is universal. You can choose any asset and time for trading. The most effective timeframe is 1 minute.
Configuration
Momentum: period 7
RSI: period 5, levels 25 and 75
Horizontal at the 50 RSI level
Support/resistance lines
Setting up the template
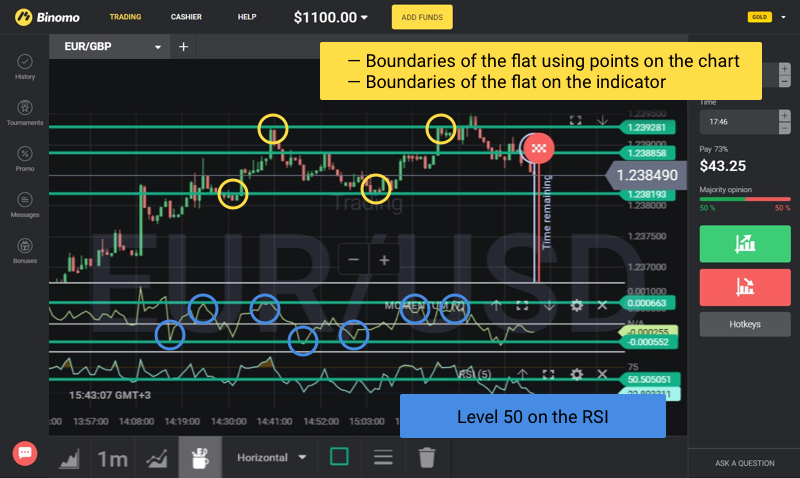
First, set up the tools and mark the levels that are important for trading with the Horizontal tool. To do this, determine the end of the trend and the transition of the price to the flat based on your experience and knowledge. We will be working precisely within this range:
1. We mark the levels of support/resistance.
2. On the RSI indicator, we select level 50.
3. On the Momentum indicator, we “eyeball” the average boundaries of current volatility. To do this, we draw horizontals above and below where the curve rests on them most often. Thus, we are singling out the extreme points of the same flat channel which we marked on the price chart, but now we need to determine them on the indicator as well. Above the upper line there will be an area of intense acceleration (penetration of the flat), and below the lower line there will be a zone of total absence of directional price movement (the “dead flat”). We will need to trade within these boundaries.
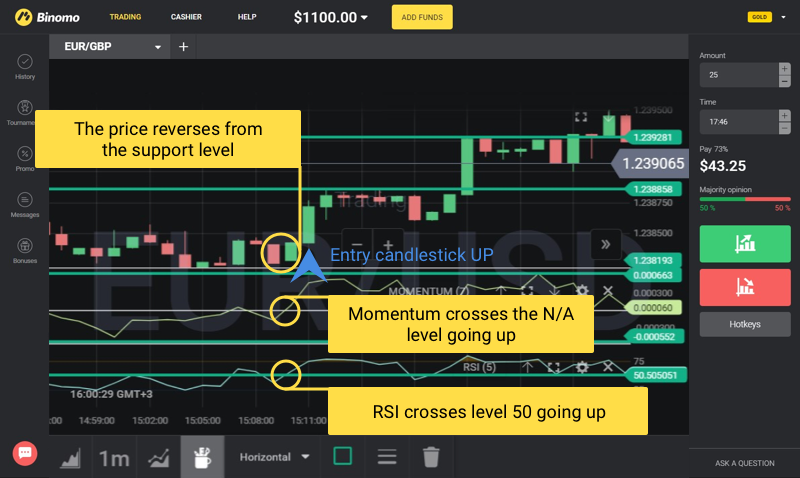
Trade UP
- The price is at the bottom support line and reverses after downward movement in the flat.
- RSI is growing: it crosses level 50 going up.
- Momentum is growing: it crosses the N/A level or the bottom horizontal going up at the same time as the RSI.
We enter a trade UP on 1-5 candlesticks.
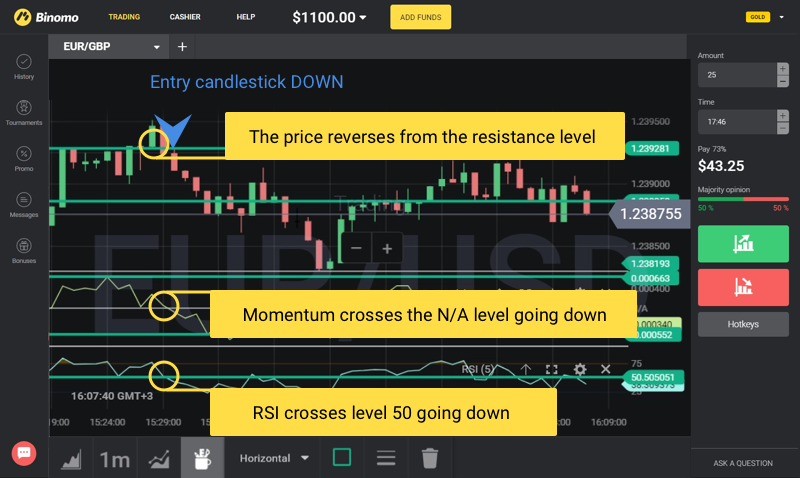
Trade DOWN
- The price is at the upper resistance line and reverses after upward movement in the flat.
- RSI is falling: it crosses level 50 going down.
- Momentum is falling: it crosses the N/A level or the upper horizontal going down at the same time as the RSI.
We enter a trade DOWN on 1-5 candlesticks.
IMPORTANT:
- The main reference point for concluding trades is the RSI indicator. Momentum is an auxiliary indicator!
- At the beginning of a flat it is better to open trades in the direction of the previous trend, the one the flat followed. The longer the flat lasts, the less applicable this remark is.


