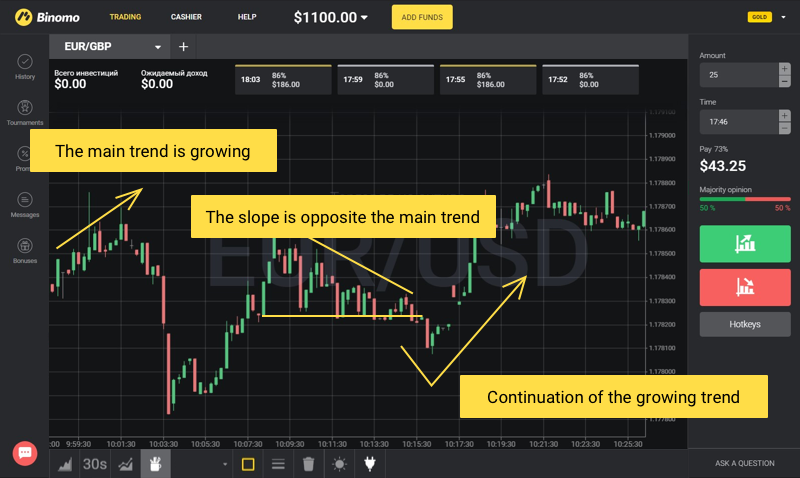
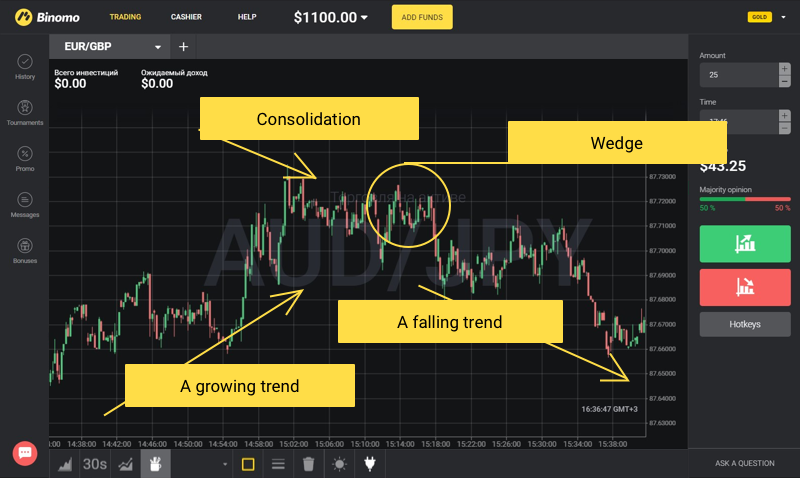
The wedge has a very strong signal.
Remember how we told you about trading in triangles? Now we’ll talk about one of the varieties of triangles – the wedge shape. The main feature and advantage of the wedge is that it is formed faster than a regular triangle, which means you won’t have to wait as long!
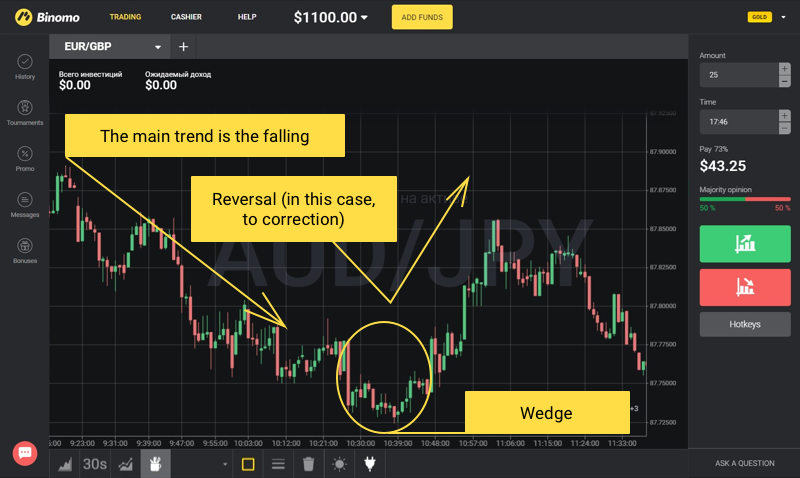
The wedge is a strong reversal pattern if it is in the direction of the trend.
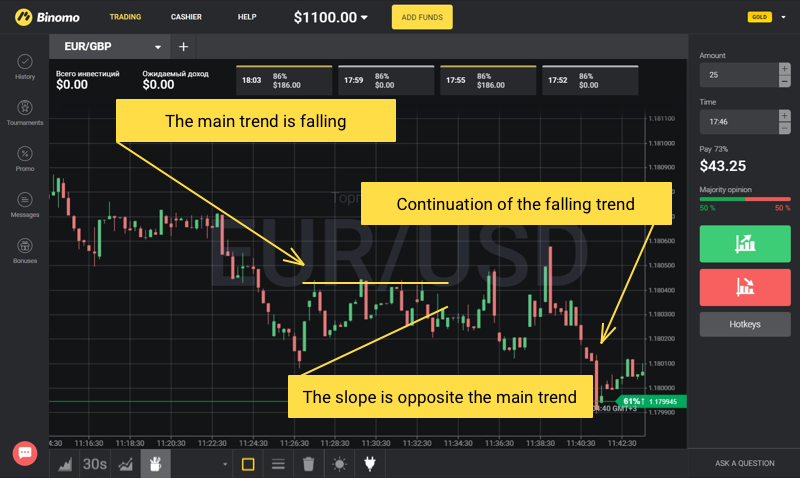
And if the wedge is in the opposite direction of the trend, this indicates a continuation of the trend, at least for the near future.
Just like when trading in triangles, it is recommended that trades be made in the direction of breakouts of the boundaries of the figure.
How to find a wedge on the chart
To be able to see the shape of the wedge, draw imaginary lines of support and resistance on a small section of the chart. The lines must converge with each other, resembling the outlines of a wedge.
Read about how to determine the levels of support and resistance in another article.
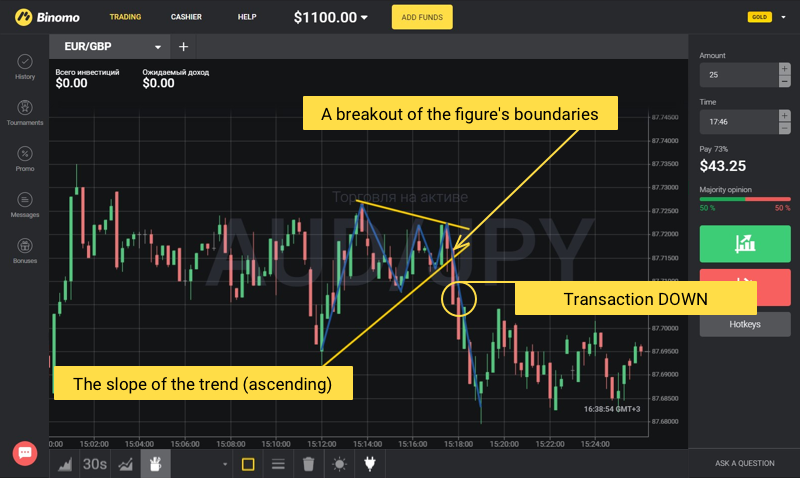
An ascending wedge on a growing trend – reversal
Levels of resistance and support are directed upwards, and a breakout usually occurs downwards. Hence, it is recommended to conclude transactions DOWN.
An ascending wedge on a falling trend – continuation of the trend
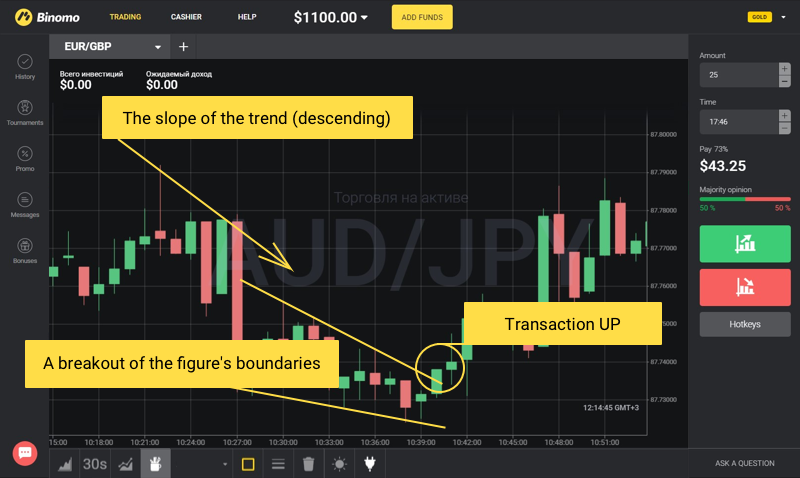
A descending wedge on a falling trend – reversal
Levels of resistance and support are directed downwards, and a breakout usually occurs upwards. Hence, it is recommended that trades be concluded UP.
And this is approximately how the figure would look on the same chart:
A descending wedge on a growing trend – continuation of the trend
Wedge after consolidation
A wedge can signal not only the end of the trend, but also the end of consolidation (a flat). At the same time, all its characteristic features are preserved, and trades are still concluded in the direction of the breakout:
Important recommendations
- This figure is best suited for trading on a trend that is ending.
- Build support and resistance lines on at least 2-3 points per line. Be patient! Wait for the formation of the figure.
- Open trades only after the breakout pattern. Wait until the candle closes BEHIND the border of the figure. Then to be sure you can wait for the formation of another candle to confirm.
- Use the “line” or “beam” tools to help you determine the levels of support and resistance. They are located in the Tools tab in the lower-left corner of the Binomo platform.
- The preferred timeframe is 15s, but you can also work in 30s or 1m.
- Increase the number of profitable trades by using different indicators.
