Why is it important to follow trading volume?
In trading, volume is a measure of how much the asset is being traded at a particular moment in time. An extremely important metric, it is often overlooked by novice traders. Read this article to understand the concept of volume better and learn how to use it in trading.
Why is it important?
Why is it important to follow trading volume? Don’t you get all necessary information from the price chart itself? Turns out, volume has extended implications. As you already know, all exchange-traded assets behave in accordance with the principle of supply and demand. The higher the supply (all else being equal) the lower the price, the higher the demand (all else being equal) the higher the price. With this in mind, try to imagine a situation when the number of deals goes up. When the market participants are uncertain and nothing about the future price can be said for sure, trading activity goes down, as for an ever-increasing number of traders the uncertainty (and, therefore, risk) becomes too high. When the trend is strong and price moves in one direction only, the increasing number of trades can be witnessed. It is, therefore, can be said that, as a rule, trading volume goes up during the strong trend and down during the flat market.

Volume indicators on the IQ Option trading platform
Note that the volume itself should not be treated as a decision-making tool. Rather, it is a complementary tool that, combined with other indicators, can help you make a sound investment decision.
How to measure volume?
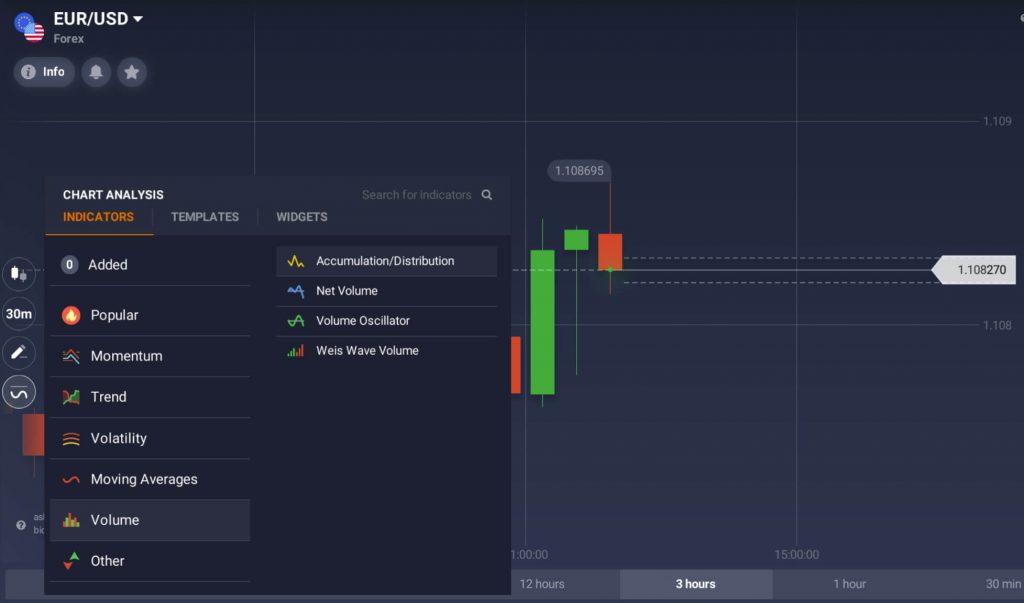
On the IQ Option platform, there are four different volume-related indicators. All four can be found in the ‘Volume‘ tab of the ‘Indicator‘ menu.
Accumulation/Distribution is a volume-based indicator that might help track the general flow of money into and out of a particular asset. When the indicator is rising, people tend to buy the asset at hand. When the opposite is true and the indicator is going down, people tend to sell it.
Net Volume is calculated by subtracting downtick volume from uptick volume over a certain period of time. Unlike general volume, it can help you determine the prevailing market sentiment. When Net Volume is below 0, the sentiment is considered to be bearish and more investors are thinking of selling the asset. When the indicator is above the zero line, the sentiment is considered to be bullish and more investors are thinking of buying the asset.
Volume Oscillator shows not the volume itself but rather the change in volume and is identical in its design to the Relative Strength Index. When the indicator is above the middle line and goes up, the volume is growing at an accelerating rate. When the indicator is below the middle line and goes down, the volume is falling at an accelerating rate. When the indicator is at zero, the volume stays exactly the same.
Weis Wave Volume takes volume and organizes it into wave charts. What you get in the end is a series of selling and buying waves. In other words, it takes volume to another dimension and helps traders to better see the connection between the price action and volume. This indicator is arguably the most complex of all four, yet it definitely deserves your attention.
As you can see, all indicators from this list have something to do with volume but deliver the information a little bit differently. Give them a try and decide for yourself what indicators better suits your personality and trading style. Who knows, maybe you would want to use each of them depending on the market conditions.
Trading volume, when identified and interpreted correctly, can greatly improve your trading results. Unlike most other technical indicators, volume doesn’t derive its readings from the price chart itself (due to the fact that volume is not displayed on the price chart)


