Binary Options indicators 

QStick Indicator.

  Trend-following indicators are numerous, and they all do approximately the same — help you identify the trend and predict its future direction. However, all of them do it slightly differently. You could use QStick if you want an easy to follow, one-line indicator that is easy to follow and really fun to use. How does it work? The principle behind the indicator is simple. QStick is a moving average of the difference between the closing and the opening price of the asset. What you get in the end is a curve that…

Read More
Binary Options indicators 

Fibonacci Lines.

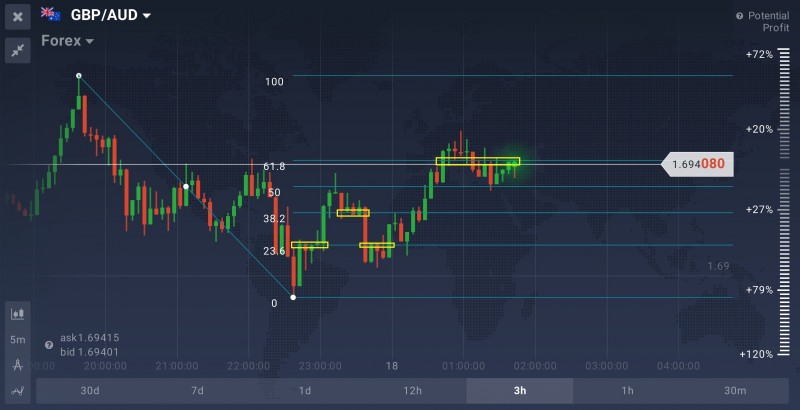
Fibonacci Lines are a powerful technical analysis tool that can be applied to both downward and upward trends, all assets and timeframes. The tool is represented on a price chart as a collection of horizontal lines that correspond to Fibonacci ratios of 23.6%, 38.2%, 50%, 61.8% and 100%. It is used to determine possible support and resistance levels. The tool is named after a 13th-century Italian mathematician Fibonacci and his self-named mathematical sequence. Applied correctly, it can help traders pick the right moment to enter a deal. How to Use…

Read More
Binary Options indicators Binary Options strategy 

Woodies CCI indicator and Trading System.

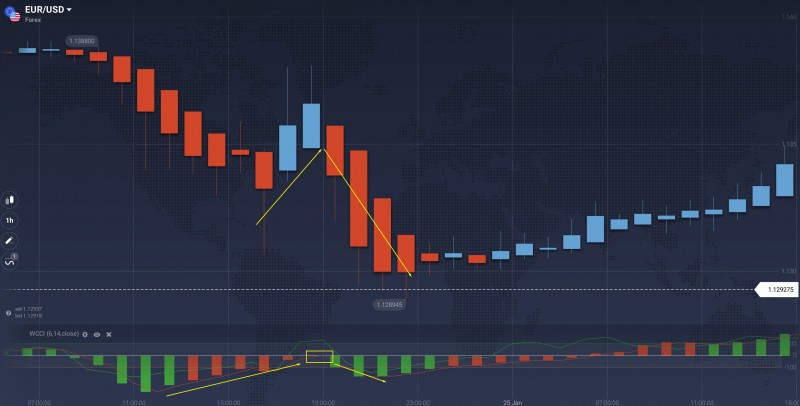
Woodies CCI is a complex technical analysis indicator developed and introduced to the trading community by Ken Wood. What’s its most distinctive feature? Woodies CCI looks and feels more like a complete trading system rather than a standalone indicator. It can, therefore, be used on its own (unlike simpler indicators that require confirmation from other technical analysis tools). Read the full article to learn how to set up and use Woodies CCI in trading. How does it work? When we say that Woodies CCI is a trading system of its own, we…

Read More
Binary Options indicators 

Moving Averages — Responsive and Smooth Indicator

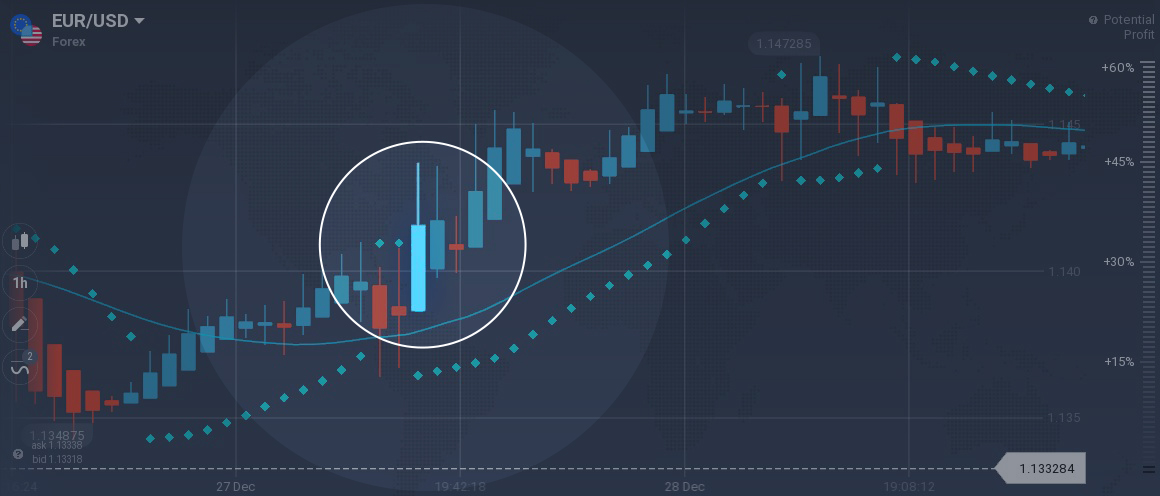
Moving averages have a reputation of an entry-level tool with limited capabilities. However, when applied correctly, they are much more complex and useful than it may seem. Today we are taking a closer look at an interesting variation of moving average that can become a valuable addition to your personal arsenal of technical analysis tools. ALMA is a relatively new indicator, that has made its first appearance as recently as 2009. It can be used for all assets and on all timeframes. It can be found in the ‘Moving Average’ tab…

Read More
Binary Options indicators 

Trading with Vortex Indicator

The Vortex Indicator is an oscillator that is used to determine the beginning of a new trend and to confirm an ongoing trend, its direction and strength. The indicator consists of two lines that capture positive and negative trend movements: the uptrend line (VI+) and the downtrend line (VI-). The essence of the vortex pattern lays in connecting the highest and lowest points of the market’s price bars or candles. The principle behind the indicator is quite simple — the greater the distance between the low of the current bar and the high…

Read More
Binary Options indicators 

Three Indicators That Go Together Better Than You Might Think

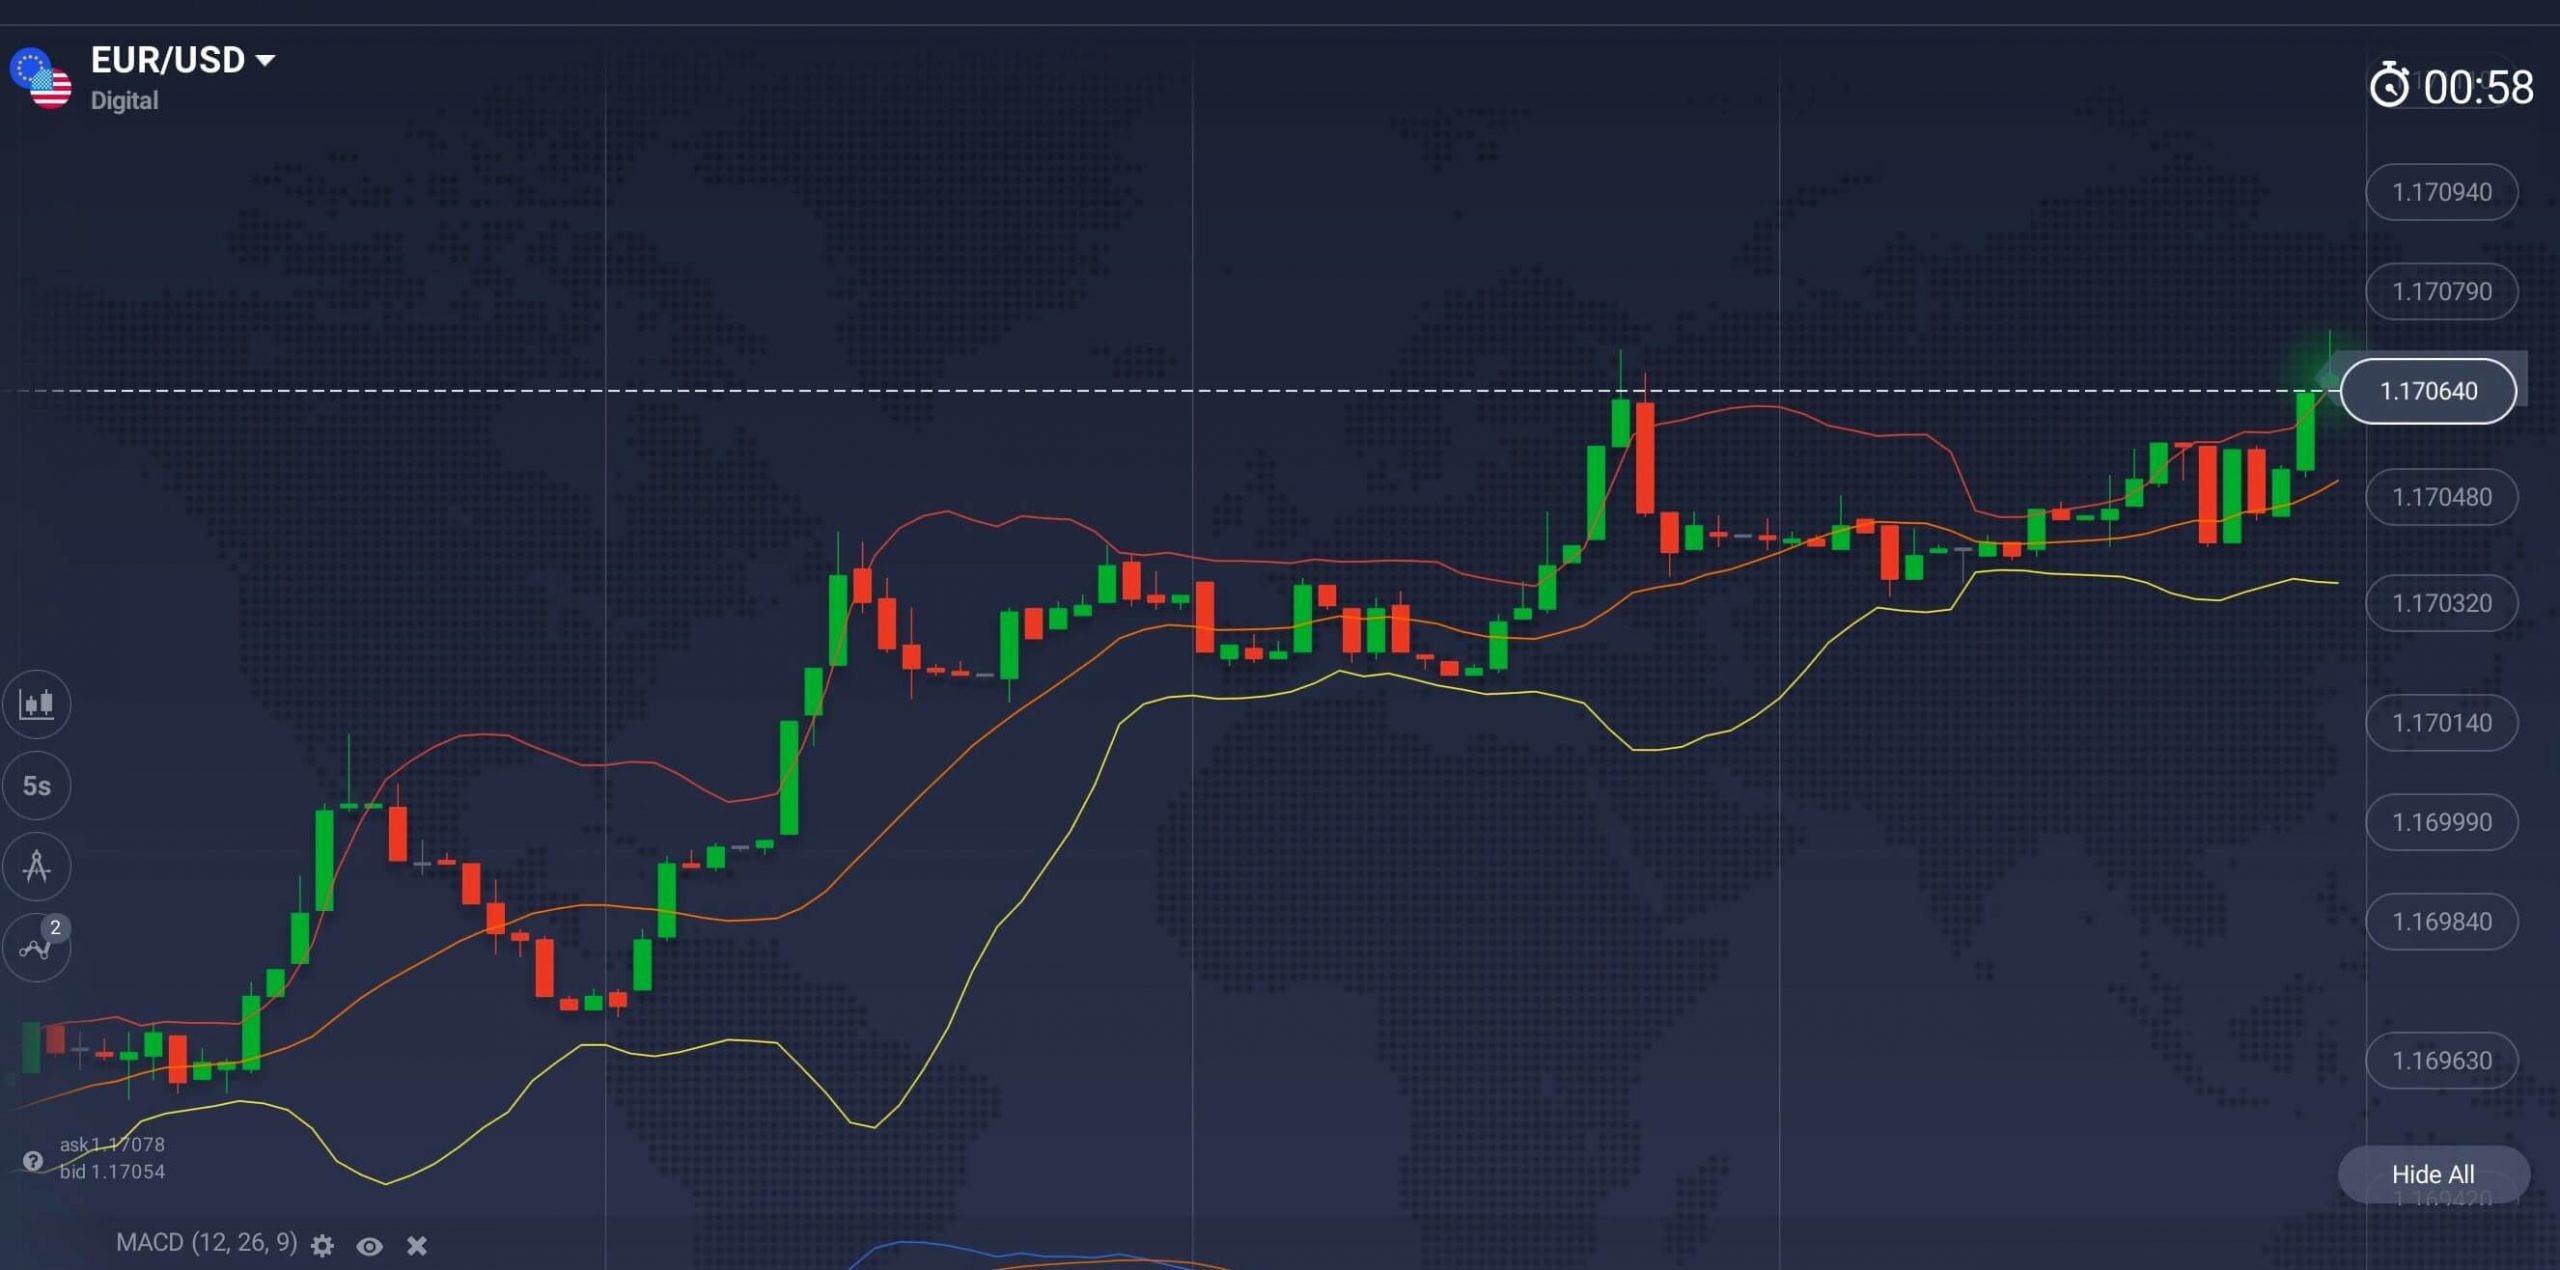
For your convenience, the IQ Option trading platform is gradually expanding the range of technical indicators. These days, not a single binary options platform works without technical indicators. In fact, a significant part of these tools can be divided into two groups: trend indicators and oscillators. For the best combination, indicators from different groups are often used. Yes, it’s that simple. There are also a few exceptions. Among them are the Ichimoku Cloud, which can be classified as both of these groups, as well as the ATR and Bollinger Bands,…

Read More
Binary Options indicators 

The Momentum indicator

The Momentum is a technical analysis tool, designed with the sole purpose of identifying the trend strength, which in turn is the velocity of price changes. The Momentum is displayed as a single line and is easy to follow. The indicator is easy to get in and will suit everyone — from novice traders to hardened investors. Read the full article to learn more about the indicators and the ways to use it. How it works? This indicator will compare the current price to the price several periods ago. The bigger the…

Read More
Binary Options indicators 

What is MACD?

As you probably already know, there is no single ‘best’ technical analysis indicator. Each of them has its time and place. However, if asked to choose their favorite tool, a lot of traders would answer “MACD”. Moving Average Convergence Divergence is a trend following indicator that is used to spot an emerging trend, whether an upward or a downward. It is by right one of the most effective and commonly used technical analysis tools ever created. In todays’ article, we will take a closer look at the indicator and learn how to apply it…

Read More
Binary Options indicators 

The Bullish Flag Pattern

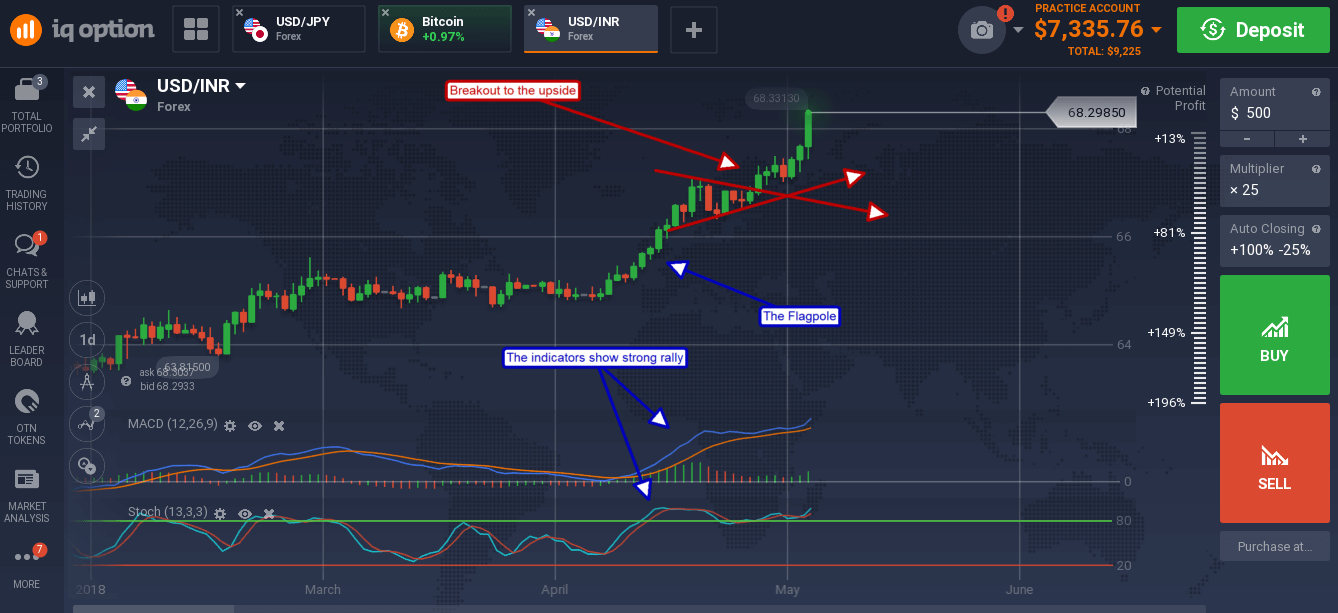
Continuation signals are awesome, they indicate a strong trend is only half over. Of course, the best time to see a continuation signal like the Bullish Flag Pattern is after you’ve entered a trade but even so they can provide highly profitable entry points. This particular continuation pattern comes with three parts; a rally, a triangle and a break-out that when completed can lead to significant gains in price. Why is it called a flag pattern? This is because the pattern forms when a symmetrical triangle forms at the end of…

Read More
Binary Options indicators 

Belkhayate Timing indicator

It is an oscillator that was designed by Mustapha Belkhayate to calculate the center of the market movement gravity. It helps to identify favorable areas for buying/selling (moments to enter the market) and possible reversal points. Traders often use it combined with the channel indicators (Bollinger Bands, Belkhayate Barycenter, Fractals etc). Belkhayate timing on the mobile app What to look at? This indicator has three areas. Let’s clarify what each area of the indicator demonstrates. 1) Middle area (a neutral zone): When the price is in this area, it is not…

Read More
Binary Options indicators 

“A clearing in the clouds” pattern

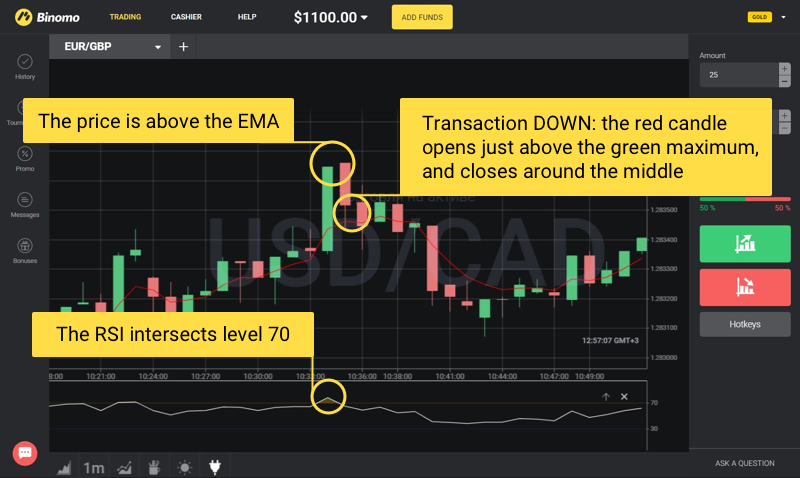
Candlestick patterns are good helpers in trading. If you can read them, then you can easily predict where the price will go. You can add a couple of indicators to the chart to verify the correctness of the tips you get from candlestick patterns, just as we did in this strategy. As a result, the number of profitable trades you have will be noticeably higher! Configure the template The recommended timeframe is from 15s to 1m; Moving Average (MA) with a period of 5 and type Exponential; RSI with a…

Read More
Binary Options indicators 

Market convergence/divergence with the RSI

The RSI (Relative Strength Index) shows the strength of the trend and the probability of changes in it. You can use the RSI in any market situation: a growing trend, a falling trend, or a flat. And on the RSI you can find one of the strongest signals for correction or trend change: market convergence/divergence. Now let’s learn how to do it. Preparing the template Choose currency pairs for trading: EUR/USD, GBP/USD, AUD/USD, USD/CHF, EUR/GBP. Why these? Because pairs with USD and EUR are the most popular on the market…

Read More