Binary Options strategy 

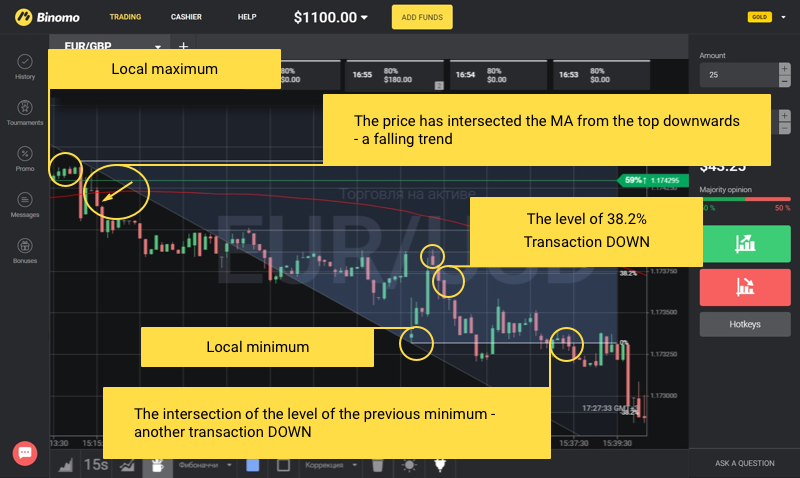
Fibonacci breakdown

Fibonacci levels are profitable when predicting the prices of any asset. They are universal, and it’s quite easy to use and adjust the levels. Now let’s show you how. Configure the template We choose the currency pair EUR/USD and a timeframe from 15s to 1m. In the lower left-hand corner, click on “Indicators” and select MA (moving average). We assign the following settings to it: Period – 120 Type – Simple Color – red Determine the trend: if the price breaks through the MA from the bottom upwards it is…

Read More
Binary Options indicators Binary Options strategy 

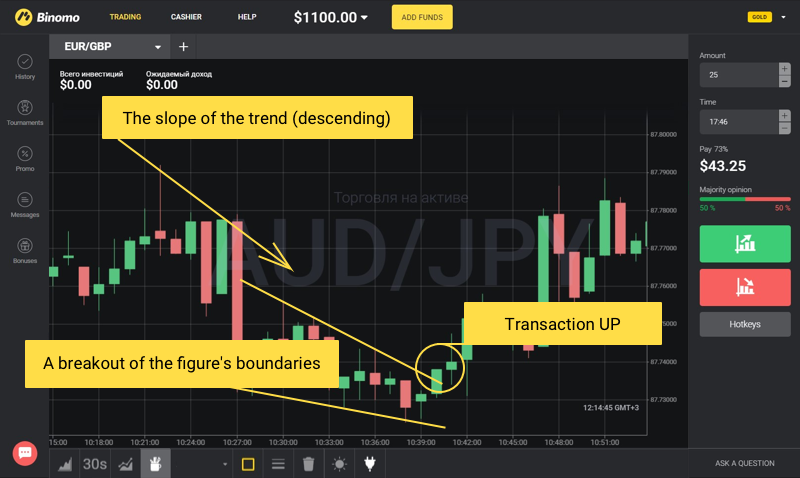
The wedge has a very strong signal.

Remember how we told you about trading in triangles? Now we’ll talk about one of the varieties of triangles – the wedge shape. The main feature and advantage of the wedge is that it is formed faster than a regular triangle, which means you won’t have to wait as long! The wedge is a strong reversal pattern if it is in the direction of the trend. And if the wedge is in the opposite direction of the trend, this indicates a continuation of the trend, at least for the near…

Read More
Binary Options strategy 

Pips Striker – profitable indicator for binary options

Many traders looking for indicator without repaint. For them does not matter that such a indicator can give false signals. The main thing is that the indicator is not repaint. If you really want to get a profitable indicator for binary options or CFD/Forex without repainting, then this article is about it. I warn you once, it is only indicator for the full trading in binary options with its use, will need additional filters. We’ll talk about this below. This indicator without repaint called Forex CFD Pips Striker Indicator v2.…

Read More
Binary Options strategy 

The “Two Waves” strategy.

Have you heard the saying: “A trend is the trader’s best friend”? It means we should trade in the direction of the trend. But we often see on the chart the following picture: the trend is going, going, and then slows down. This slowdown is called consolidation. And if you know how to determine the end of consolidation, you will earn. How to do it? For starters, you can use the Wolf’s Wave concept. Use it to know exactly when and where the price will continue in the direction of…

Read More
Binary Options strategy 

Three candles strategy

Three candles can help you make the right prediction: whether the chart will reverse or not. But these need to be special candles, and they also have to be found. Fortunately, this is not difficult. You just need to identify the simple figures that are formed on the chart before the reversal. We will tell you how to find them. Three soldiers and three crows. How to conclude transactions “Three Soldiers” is a reversal pattern on the chart when three growing candles of approximately the same size appear during a…

Read More
Binary Options strategy 

The binary options tool “Gartley”

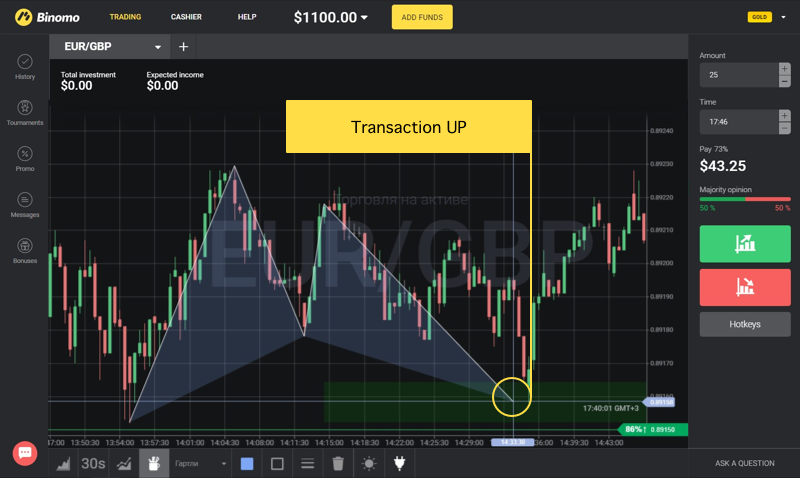
The tool is based on two theories: Fibonacci Sequence (the Golden Ratio) and Gartley’s theory of reccuring patterns. There are certain patterns of price movements which can be identified using Gartley. This tool helps to visually identify areas of reverses. It is also called the Gartley Butterfly because it looks like this: Or like this: It’s easy to build: 1. Choose an interval with a correction as shown in the screenshots above. 2. Mark the main movement: find the Gartley tool in the platform menu and click on it. Then…

Read More
Binary Options strategy 

The 20+RSI strategy

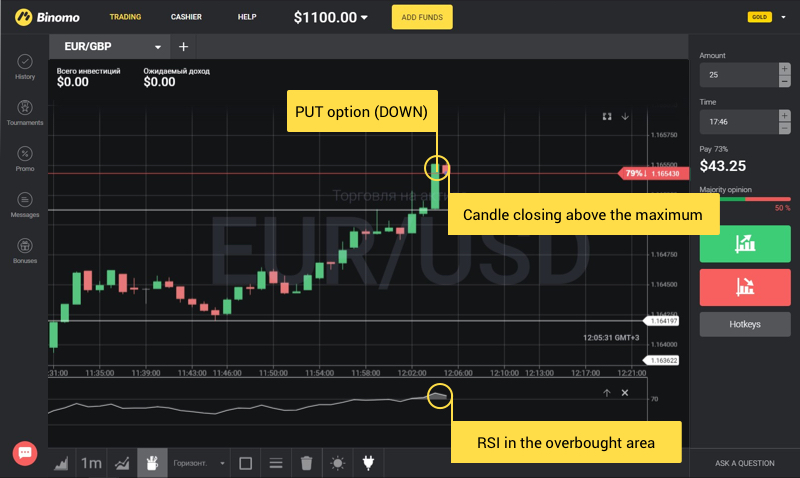
Did you know that asset prices often make turns the next day after a 20-day minimum or maximum? This is true for any scale, since the market repeats itself on all timeframes. The 20+RSI strategy is based on this principle: you need to count 20 candles back to predict a turning moment. Setting up the template Open the Binomo platform and select 1-minute timeframe on the candlestick chart. Set the RSI indicator period at 14, with the overbought and oversold levels at 70 and 30 respectively. Using the Rectangle tool,…

Read More
Binary Options strategy 

The Drifter Strategy

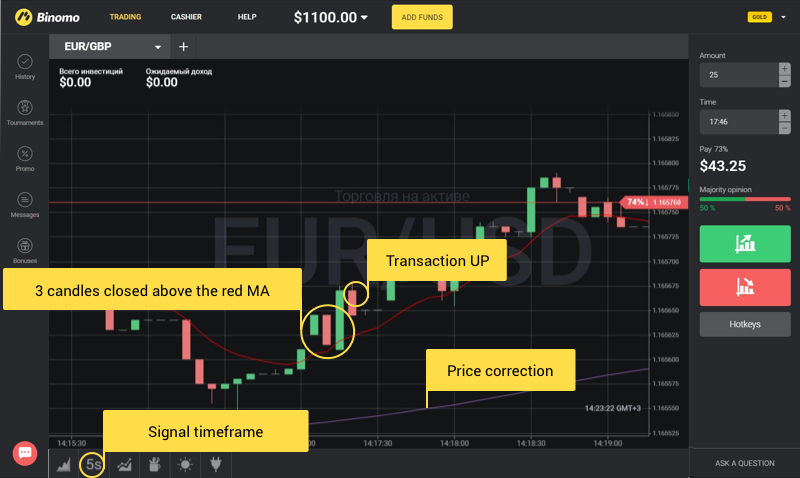
How to make Three Screens signals even more profitable? We know how: change the timeframes, add moving averages and… don’t miss the moment! Here’s a step-by-step tutorial on how to properly and efficiently trade on the Drifter strategy. Setting the template Apply two MA (moving average) indicators to the quotation chart. The first MA should be set as follows: Exponential type, Period 10, Red color. The second is configured like this: Exponential type, Period 114, Purple color. Open three screens with timeframes of 30, 15 and 5 seconds. You need…

Read More
Binary Options strategy 

Points out the turning moments

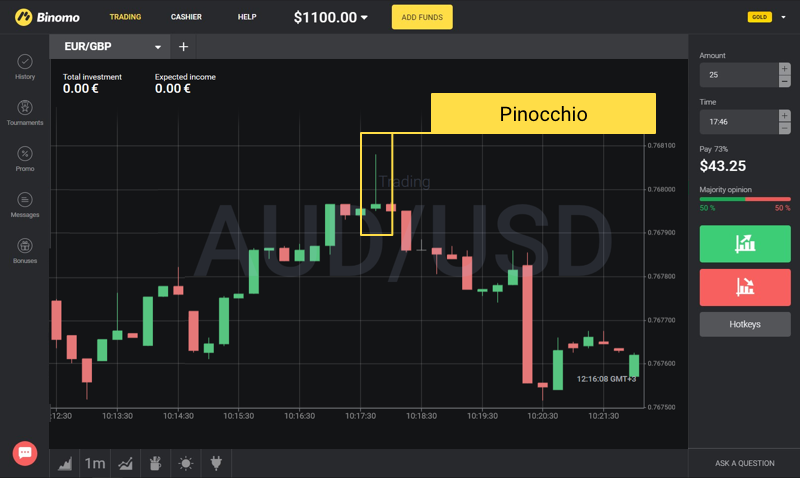
The information you see below will help you learn to use the Pin Bar as a tool for making profit. This pattern is easily recognised on charts: it’s a candle with a small body, a small shadow on one side and a big shadow on the other. Traders call it “Pinocchio” and consider it a good balid signal for making deals. Pinocchio usually appears at the top or the bottom of the trend just prior to a turn. The long shadow of the Pin Bar always faces the direction of…

Read More
Binary Options strategy 

Signal of trend continuation – Flag Figure

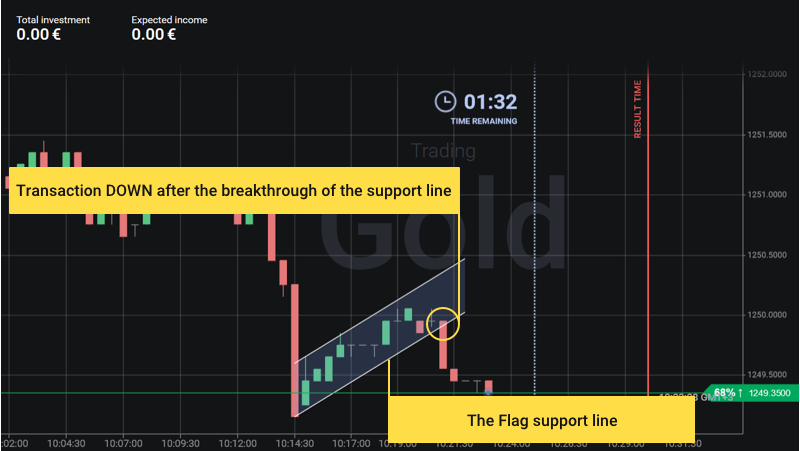
The Flag figure forms in the course of a dynamic price change, for instance, following the publication of important statistics, speeches, political events. When this is the case, quotes usually grow or fall sharply and enter correction from time to time. When the Flag appears it means the correction is over. In other words, if you detect a Flag and close the transaction in the direction of the trend, you’re highly likely to make a profit! What does the Flag look like? As we mentioned above, the Flag appears during…

Read More
Binary Options strategy 

Trade in flat

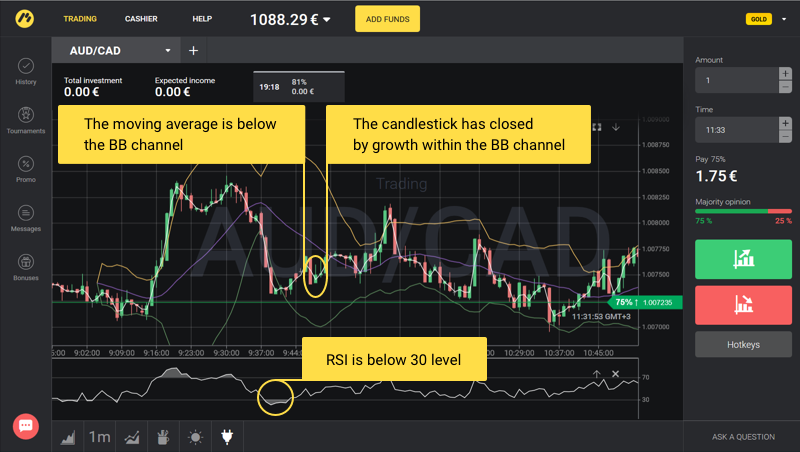
In the evening and at night the market “flats”: it moves calmly within a price corridor. Fluctuations are small, but predictable. Now we’ll tell you how to determine the turning points of quotes in flat. Preparing a template First, choose the Bollinger Bands indicator with the default settings. It will show the moments of maximum price deviation from its mean value. Then select the RSI (Relative Strength Index), which will indicate price reversal points. Apply these settings: Length – 9 Overbought level – 70 Oversold level – 30 Add the…

Read More
Binary Options strategy 

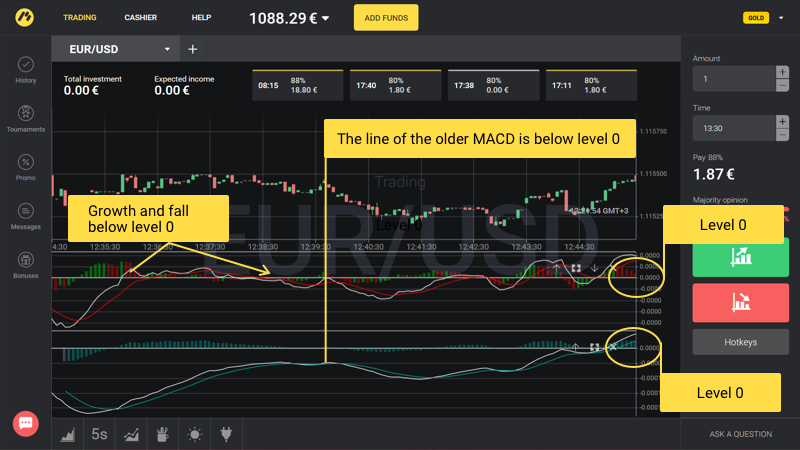
MACD double crossover

You have probably noticed that the most effective strategies often use the MACD indicator. And what will happen if you take two MACD instead of one? The performance is doubled! The key point is to achieve their right configuration and understand the signals to start trading. This is what we are going to teach you now! How to set the indicators Traders who want to make use of this strategy should apply the two MACD indicators to the chart. To do this, click on the “Indicators” button in the lower…

Read More